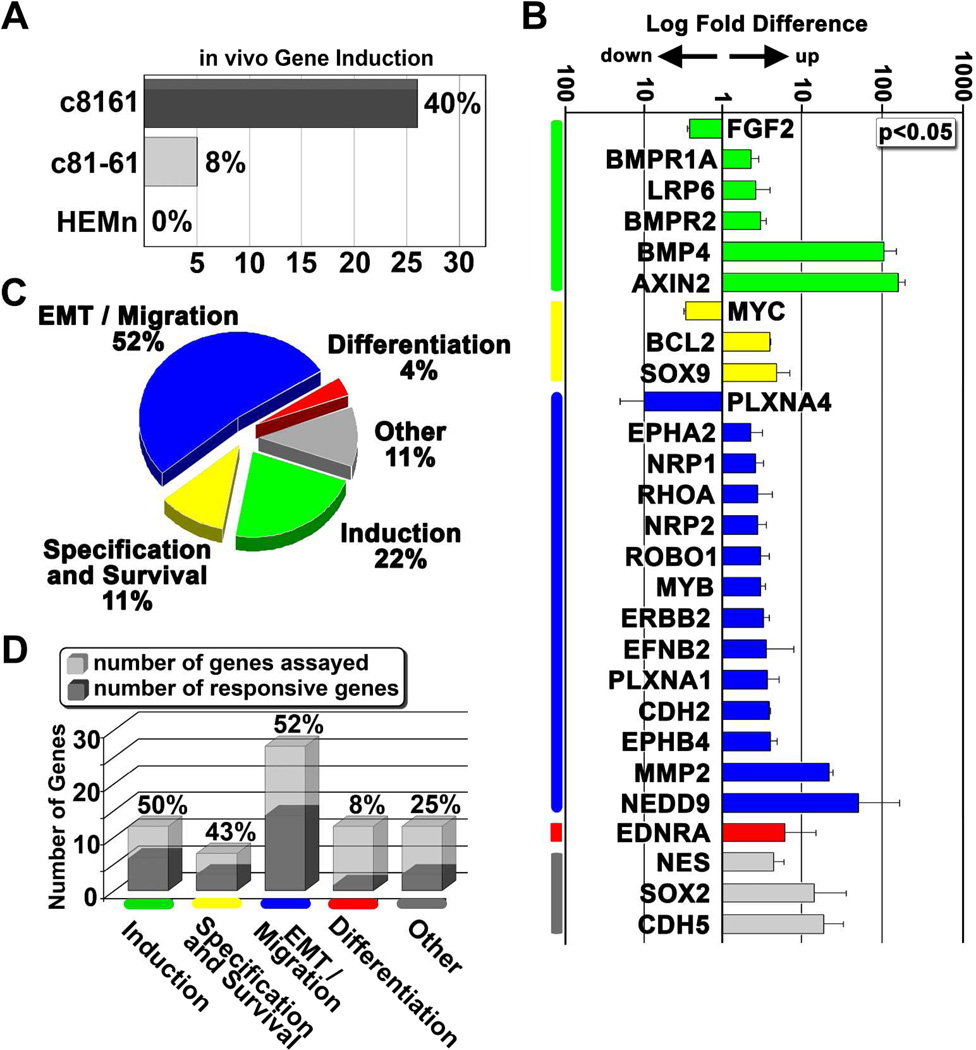
Figure 2. Differential expression of neural crest-related genes from human melanoma and melanocyte cells following exposure to the chick embryonic microenvironment.
A) The percentage of total analyzed genes that showed a significant induction following transplantation. c8161 is an invasive human melanoma cell line. c81-61 is a poorly invasive isogenic counterpart to c8161. HEMn are primary human melanocytes. B) A graph showing log fold changes in gene expression following transplantation of c8161 melanoma into the embryo. All genes are normalized to gene expression values acquired from cultured cells, represented by the baseline expression level of 1. All changes reported were statistically significant with a p-value < 0.05 based on the parametric Limma statistical analysis (Jeanmougin et al., 2010) and adjusted using the Benjamini-Hochberg method. Error bars represent the standard deviation of three biological replicates. Genes are grouped based on their involvement with the neural crest program: induction (green), specification and survival (yellow), EMT and migration (blue), differentiation (red). Genes not specifically associated with any of these steps were grouped under the category “other” (gray). C) A pie chart depicting the percentage of induced genes from Figure 2C involved in aspects of the neural crest program: induction, specification, EMT and migration, and differentiation. D) A bar graph illustrating the percent induction of genes involved in the neural crest program, separated by the phases of the neural crest program.

