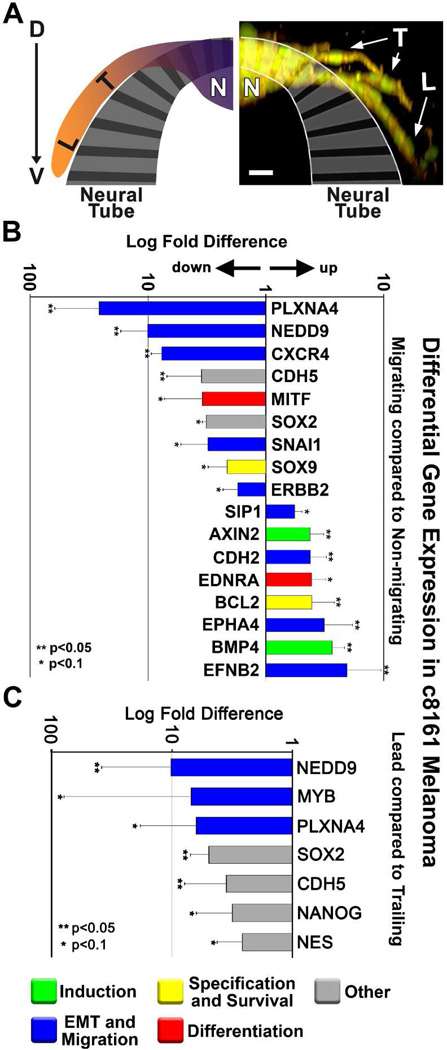
Figure 3. Differential gene expression of migrating compared to non-migrating melanoma cells.
A) An immunofluorescent image and accompanying cartoon depicting the biological domains from which melanoma cells were harvested for gene analysis. Domains include “L” for leading cells, “T” for trailing cells, and “N” for non-migrating cells. c8161 melanoma cells are dual-labeled with an H2B:cerulean nuclear marker (pseudo-colored green) and a Gap43:YFP membrane marker. The image is displayed as an XZ projection of an XY z-stack. The image was acquired with a Zeiss 20X NA 1.0 objective. The image is viewed dorsal (D) to ventral (V) along the y-axis. The scale bar represents 30 microns. B) A graph depicting relative fold-changes in gene expression observed in migrating c8161 melanoma cells. Values are displayed as log fold difference. C) A graph depicting relative log-fold changes in gene expression observed in leading c8161 melanoma cells. Error bars represent the standard deviation of three biological replicates. ** depicts changes with p<0.05, * depicts changes with p<0.1 based on Limma statistical analysis.

