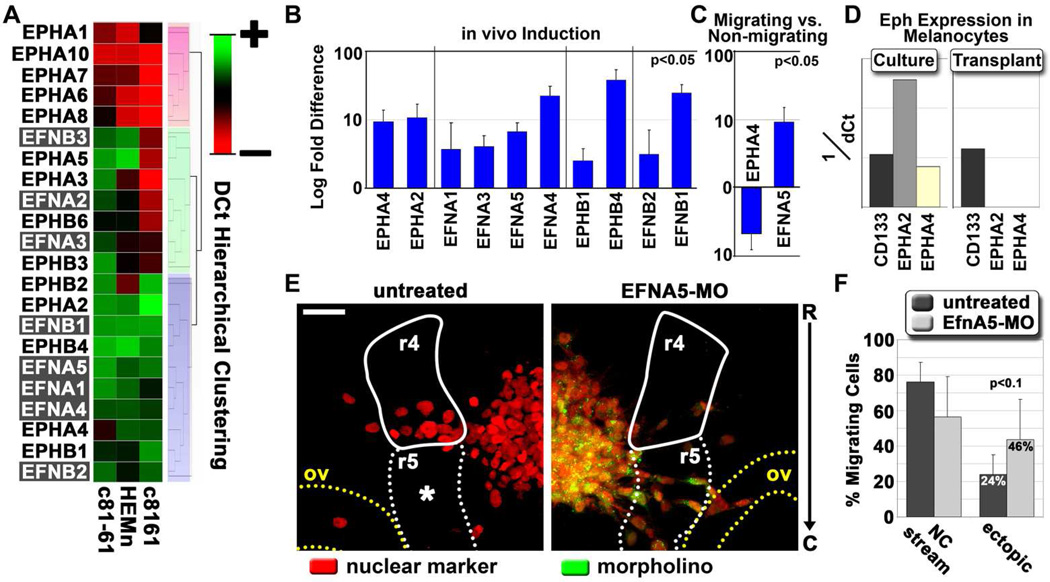
Figure 7. Eph and ephrin expression and regulation in melanoma cells and primary melanocytes.
A) Hierarchical cluster analysis based on dCt (cycle threshold normalized for input amount) values. All known human Eph and ephrin family members were analyzed for expression in c8161, c81-61 and primary melanocytes (HEMn). Three primary clusters are highlighted by red, green and gray boxes. B) A graph depicting the induction of Eph/ephrins expressed by c8161 cells following transplantation into the chick embryo, compared to gene expression values from cultured cells. All reported gene expression changes were statistically significant with an adjusted p-value < 0.05. Error bars represent the standard deviation of three biological replicates. C) A graph depicting log-fold changes in Eph/ephrin gene expression observed in migrating c8161 melanoma cells compared to non-migrating cells. D) A graph depicting the expression of EPHA2 and EPHA4 in primary melanocytes harvested from culture or from transplants. Normalized values are provided as 1/dCt. CD133 was used as a positive expression control. E) Microscope images acquired from chick embryos transplanted with wild-type c8161 melanoma cells or c8161 cells pre-treated with a translation-blocking morpholino against ephrin-A5. Cells were labeled with an H2B:cerulean fusion construct (pseudo-colored red). Morpholinos were tagged with lissamine and pseudo-colored green. Embryonic tissue boundaries and fiducial points are provided, including rhombomere 4 in the hindbrain (r4, solid white line), rhombomere 5 (dashed white line), and the otic vesicle (ov, dashed yellow line). The image is viewed rostral (R) to caudal (C) along the y-axis. Fluorescent images represent projected z-stacks, based on a maximum intensity projection. Images were acquired using a Zeiss 20X NA 1.0 objective. Scale bar is 50 microns. F) A graph depicting the percent of c8161 migratory cells that emigrated along the canonical neural crest rhombomere 4 migratory pathway versus those that breached typical migratory pathway boundaries. Values are given as a percent of total migrating cells. Error bars represent the standard deviation of four biological replicates. The statistical analysis was performed using a Student’s t-test.

