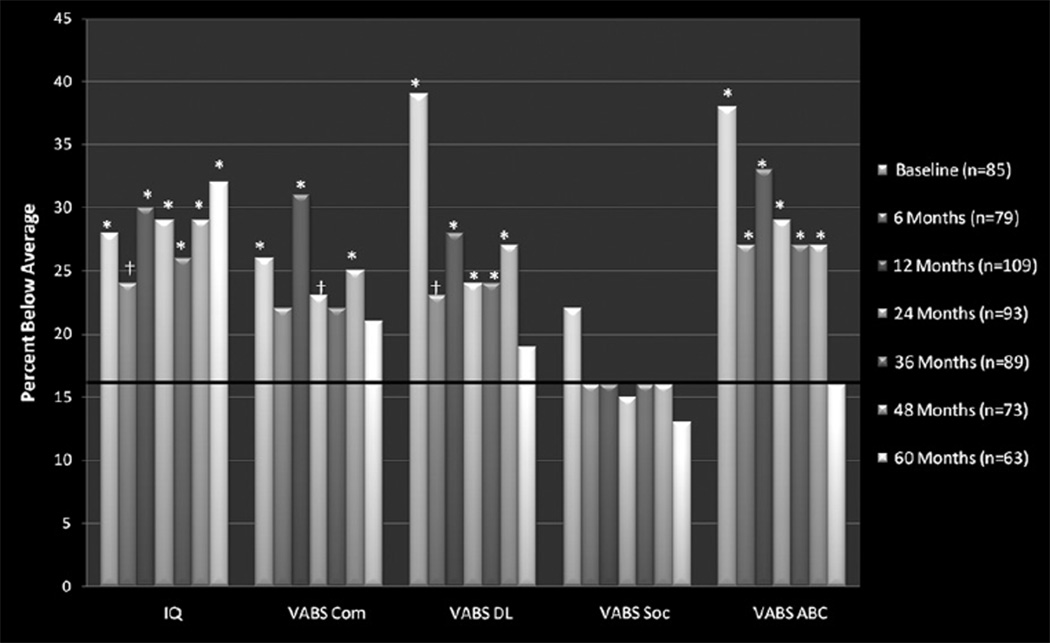
Fig.
Percentage of IQ and adaptive behavior scores falling below the average range (<85) at each time point. Solid line at 16% denotes the expected proportion of below-average scores based on a normally distributed population estimate. ABC = Adaptive Behavior Composite; Com = Communication Index; DL = Daily Living Skills index; Soc = Socialization index; VABS = Vineland Adaptive Behavior Scale. *Significantly greater than 16% is indicated at P<.05; †nonsignificant trend at P<.10.

