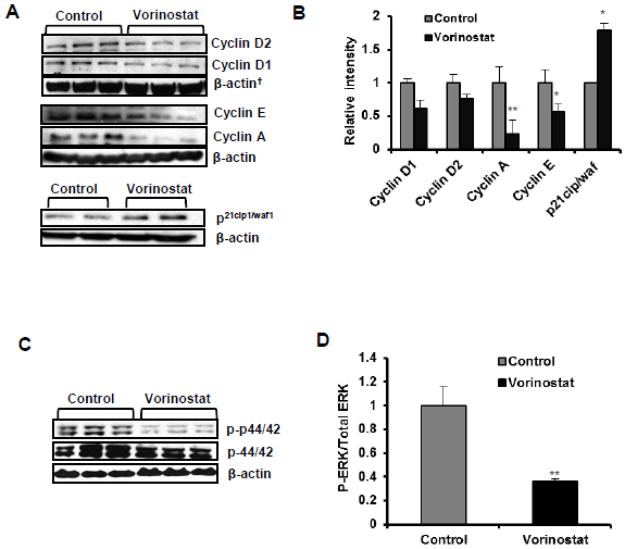
Figure 4. Vorinostat blocks cell cycle progression and activation of ERK1/2.
(A) WB analysis for cell cycle regulatory proteins in vehicle-treated control and vorinostat-treated group. Cyclin D1 (p=0.069), Cyclin D2 (p=0.220), Cyclin A (**p=0.002), Cyclin E (*p=0.015) and p21cip1/waf1 (*p=0.057). (B) Image J analysis of cell cycle regulatory proteins. Results normalized to corresponding β-actin band densities. (C) WB analysis of ERK1/2 signaling proteins: p-44/42 (p=0.379) and p-p44/42 (*p= 0.014). (D) Image J analysis for ERK1/2 proteins.

