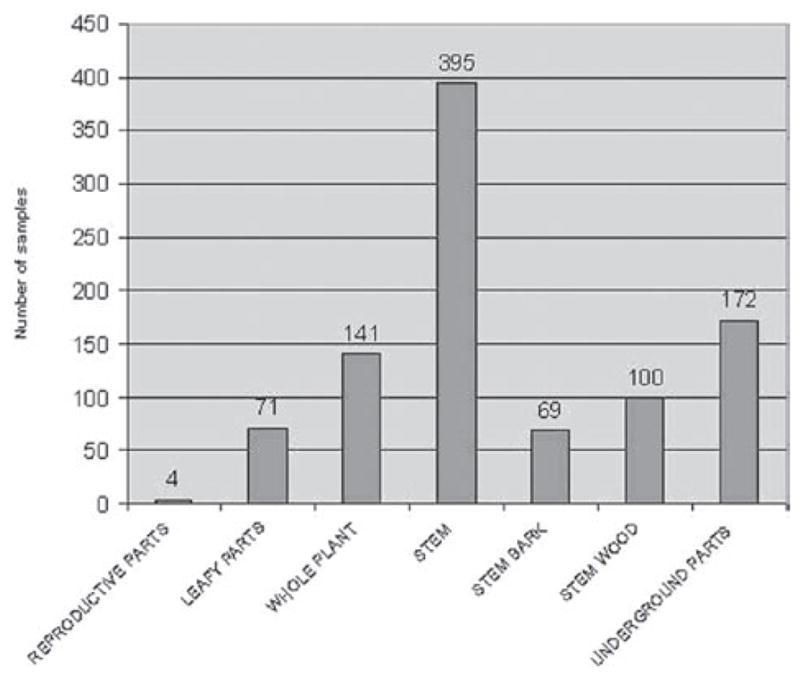
Figure 7.

Frequency distribution of plant parts of the plant samples collected. The data used to structure this histogram were derived from data in Table 2. The discrepancy (3 plant parts) between the total number of samples (955) and the number of plant parts (952) of the samples collected is due to the fact that the plant parts of three samples were described as “unknown” and have been excluded from the Figure 7 (see text for further details).
