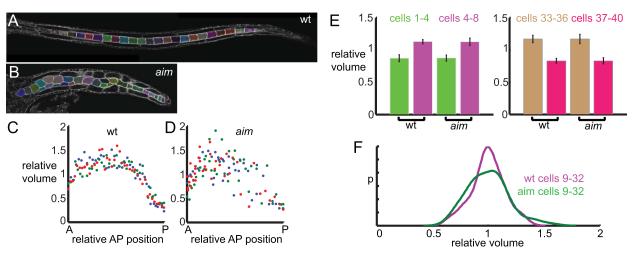
Figure 6. Cell volumes in wildtype and aim embryos.
(A, B) Representative images of segmented notochord cells in (A) wildtype and (B) aim/aim embryos. (C, D) Cell volume as a function of AP position in (C) wildtype and (D) aim/aim embryos. As aim embryos are much shorter than wildtype, AP position is normalized to the length of each notochord. Data points for each of 3 segmented notochords for each genotype are labeled different colors. (E) Relative cell volumes for cells 1-4 (green) versus 5-8 (magenta), and cells 33-36 (brown) versus 37-40 (red). We observed some intermingling of primary and secondary notochord cells in aim/aim but not wildtype embryos, so for this assay, we defined cells 33-36 as the anteriormost 4 of the 8 secondary notochord cells and cells 37-40 as the posteriormost 4 of the 8 secondary notochord cells. The secondary cells were always distinguishable by their lower volume. Error bars show the standard error of measurement. (F) Kernel density estimate histogram of relative cell volumes for cells 9-32 in wildtype (magenta) and aim (green) embryos.

