Figure 1.
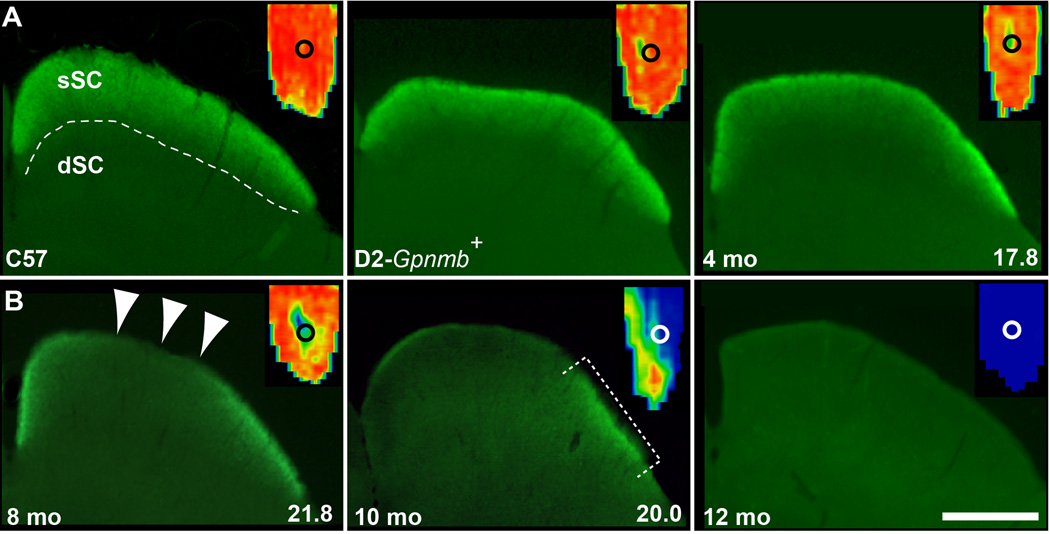
Micrographs of the superior colliculus (SC) in cross-section (coronal plane) following intravitreal injections of cholera toxin β (CTB). A) SC of C57BL/6 (C57), D2-Gpnmb+, and a 4 mo DBA/2J each demonstrate intact CTB signal (green). Dashed line demarcates retinal recipient zone in superficial SC (sSC) from deep (dSC). B) SC from an 8 mo DBA/2J (left) shows a focal deficit (arrowheads), while a 10 mo (middle) has only residual signal (bracket) and a 12 mo (right) has complete depletion. Insets show retinotopic map reconstructed from serial sections through each SC with representation of optic disc gap (circle). Signal density ranges from 100% (red) to 50% (green) to 0% (blue) (Crish et al., 2010). Average lifetime IOP for the 4, 8 and 10 mo DBA/2J is indicated. Scale = 500 µm.

