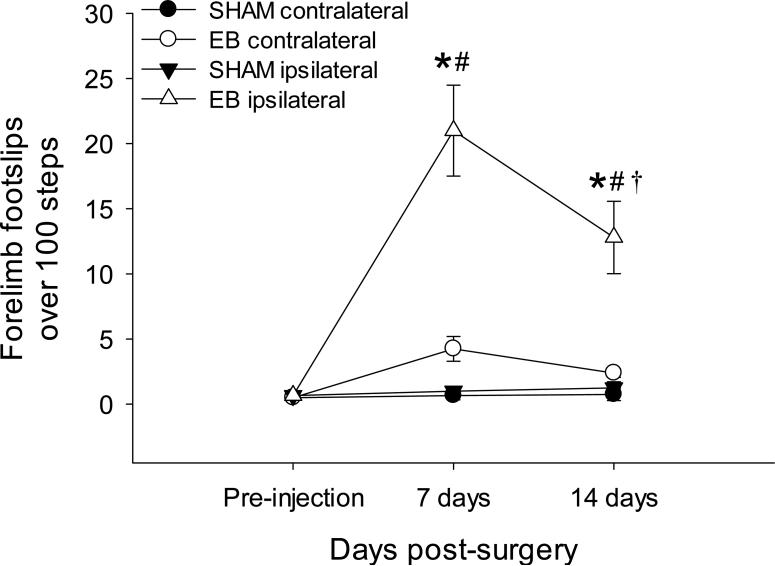
Figure 5.
The average number of foot slips from 100 steps over time. Filled circles indicate foot slips contralateral to the injection site in SHAM rats, filled triangles indicate foot slips ipsilateral to the SHAM injection site, open circles indicate foot slips contralateral to the EB injection, and open triangles indicate foot slips from the ipsilateral limb to the EB injection. SHAM animals showed no differences in function between limbs or over time (all P>0.05). Contralateral limb function of EB-injected rats did not differ from SHAM rats (7 days: P=0.24, 14 days: P=0.49). At 7 and 14 days, the ipsilateral limb of EB rats had significantly more foot slips when compared to pre-injection levels and to the contralateral limb at each time point (all P<0.001). Although the ipsilateral limb of EB-injected rats had less slips at 14 days when compared to the ipsilateral limb at 7 days (P<0.001), the number of foot slips remained significantly higher than pre-injection or SHAM levels at each time point (both P<0.001). *P<0.05 versus contralateral foot slips in EB injected rats and both ipsi- and contralateral foot slips in SHAM rats within the same time point, †P<0.05 versus ipsilateral foot slips 7 days post-EB, #P<0.05 versus pre-injection levels within the same group; two-way ANOVA.

