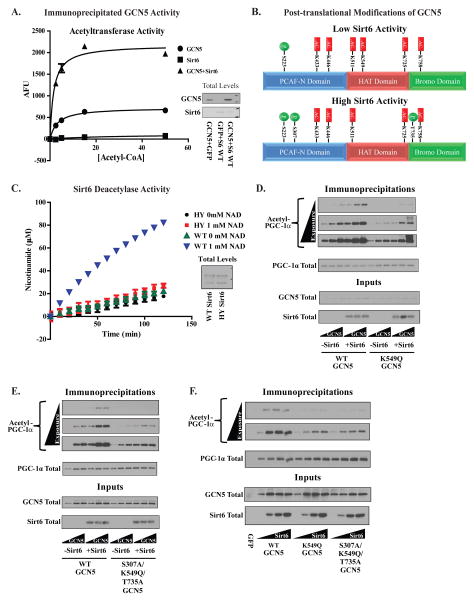
Figure 3. Sirt6 increases GCN5’s acetyltransferase activity and alters the profile of post-translational modifications on GCN5 protein.
(A) In vitro acetyltransferase activities of GCN5 immunoprecipitated from the nuclear fraction of U-2 OS cells with and without Sirt6. (B) Post-translational modifications mapped by mass spectrometry on GCN5 immunoprecipitated from U-2 OS transfected with empty vector (top panel) or WT Sirt6 (bottom panel). Phosphorylated residues are indicated in green and acetylated residues in red. 49% sequence coverage was obtained in these experiments (C) Measurement of the in vitro deacetylation of a peptide containing acetyl-K549 using nicotinamide production as an indicator of deacetylase activity. WT Sirt6 and H133Y Sirt6 were immunoprecipitated from U-2 OS infected with adenoviral constructs. (D) A test of WT and K549Q GCN5’s effects on PGC-1α acetylation in the presence/absence of Sirt6 expression. Increasing concentrations of GCN5 construct were transfected along with a fixed concentration of Sirt6 and PGC-1α. (E) Evaluation of WT and S307A/K549Q/T735A GCN5’s effects on PGC-1α acetylation in the presence/absence of Sirt6. Experimental setup was identical to that shown in Figure (D). (F) Comparison of sensitivities of WT, K549Q and S307A/K549Q/T735A GCN5 to increasing concentrations of Sirt6 using acetylated PGC-1α. GCN5 and PGC-1α were transfected into U-2 OS cells at a fixed concentration along with Sirt6 at increasing concentrations. Data are means±S.E.M. See Figures S2,3.

