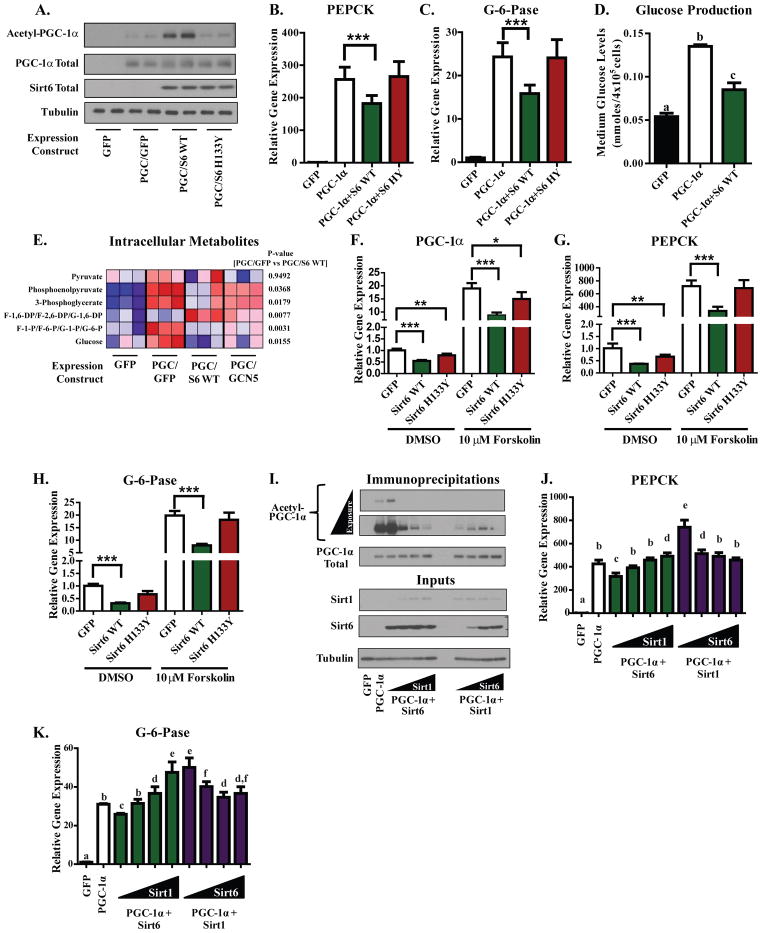
Figure 4. Sirt6 elevates PGC-1α acetylation in murine primary hepatocyte cultures and suppresses the gluconeogenic program in direct opposition to Sirt1.
(A) Measurement of PGC-1α acetylation in murine primary hepatocyte cultures expressing GFP, WT Sirt6, or H133Y Sirt6. (B,C) Assessment of PEPCK (B) and G-6-Pase (C) mRNA levels in murine primary hepatocyte cultures expressing the indicated constructs. In Figures (A–C), data are a composite of three separate experiments. (D) PGC-1α-induced glucose production in primary hepatocytes co-expressing either GFP or Sirt6. Data are an average of two independent experiments. Columns with different letters above them are statistically significant. (E) Heat map depicting LC-MS analysis of intracellular metabolites from primary hepatocytes expressing the indicated constructs. (F–H) Assessment of PGC-1α (F), PEPCK (G), and G-6-Pase (H) mRNA levels in primary hepatoctyes infected with GFP, WT Sirt6, or H133Y Sirt6 expression constructs and treated for 1.5 h with DMSO vehicle or 10 μM forskolin. In Figures (F–H), data are pooled from three independent experiments. (I) Competitive effects of Sirt6 and Sirt1 on PGC-1α acetylation in primary hepatocytes. Cultures were infected with a fixed dose of one sirtuin while the amount of the other was progressively increased (total viral infection was equal across all treatments). (J,K) Gluconeogenic gene expression from the experimental setup in (I). Data are from two independent experiments. Columns with different letters above them are statistically significant (p<0.05). All data expressed as means±S.E.M. and analyzed by one-way ANOVA with a Tukey’s post-test. See Figure S4.

