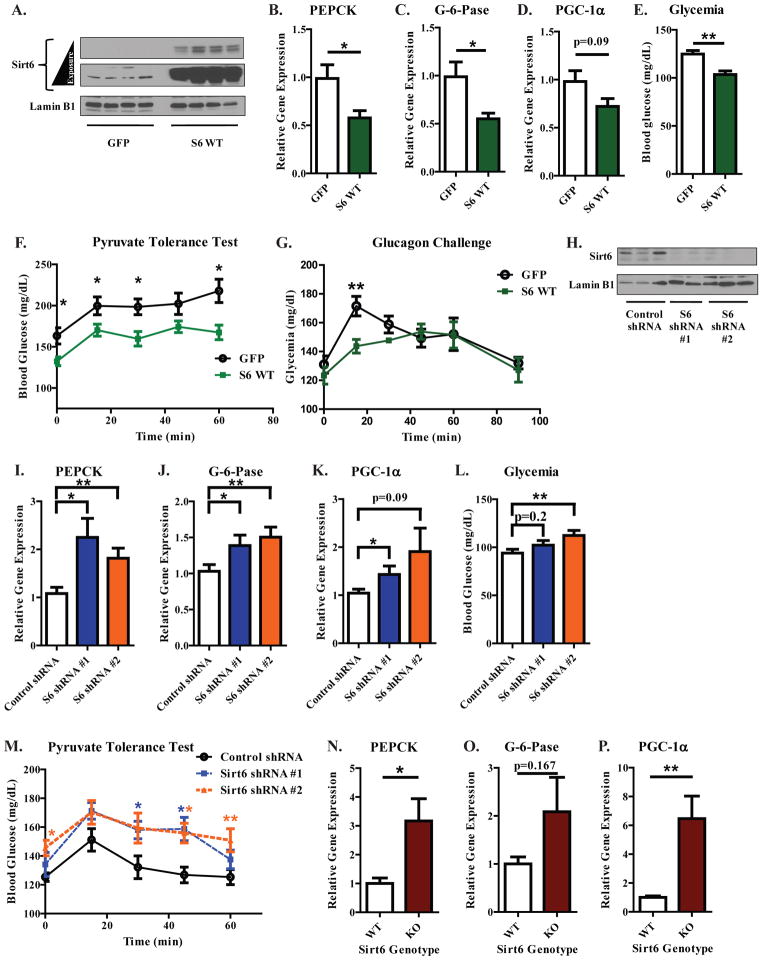
Figure 6. Hepatic Sirt6 levels regulate the gluconeogenic transcriptional response of fasted C57BL/6 mice.
(A) Hepatic Sirt6 protein levels from mice injected with either GFP or 3xFLAG WT Sirt6 adenoviruses. Mice were fed ad libitum for 4 days after injection and then fasted for 16 h before being sacrificed. (B–D) Hepatic gene expression data for PEPCK (B), G-6-Pase (C), and PGC-1α (D). (E) Blood glucose levels from mice infected with the indicated constructs (A). Figures (A–E) were compiled from two independent experiments (N=8–9 mice per treatment group) and analyzed by a two-tailed unpaired t-test. (F) Effect of hepatic Sirt6 over-expression on a pyruvate tolerance test (N=8 per group, analyzed by a two-tailed unpaired t-test). (G) Effect of hepatic Sirt6 over-expression on glucagon-induced changes in glycemia (N=8 per treatment group, analyzed by a two-tailed unpaired t-test). (H) Hepatic Sirt6 protein levels from mice receiving a tail-vein injection of the indicated adenoviral shRNA constructs. Mice were fed ad libitum for 3 days after injection and then fasted for 15 h before being sacrificed. (I–K) Hepatic PEPCK (I), G-6-Pase (J), and PGC-1α (K) mRNA levels from mice treated as in (H). (L) Blood glucose levels from mice treated as in Figure (H). Figures (H–L) were compiled from two separate experiments (N=13–14 mice per treatment group; analyzed by one-way ANOVA with Dunnet’s post-test). (M) Effect of hepatic Sirt6 knockdown on a pyruvate tolerance test (N=8 per treatment group; analyzed by one-way ANOVA with Dunnet’s post-test). See Figure S5.

