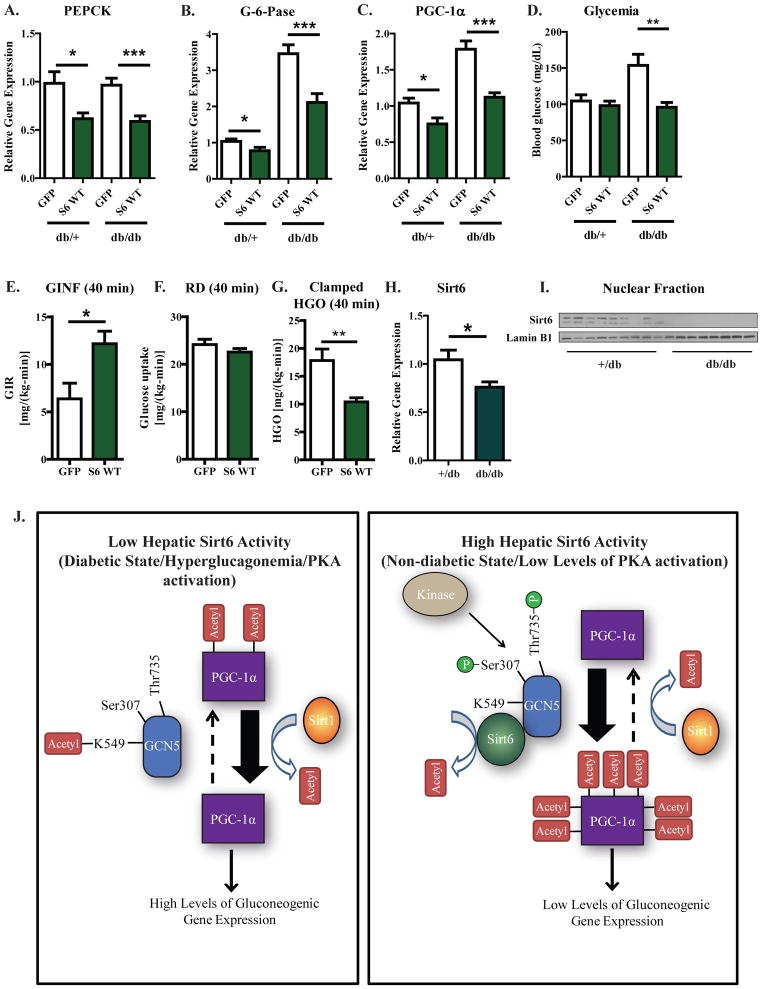
Figure 7. Sirt6 suppresses the gluconeogenic program and reduces blood glucose levels in diabetic db/db mice.
(A–C) Hepatic PEPCK (A), G-6-Pase (B), and PGC-1α (C) mRNA levels from +/db and db/db mice injected with GFP or 3×FLAG WT Sirt6-expressing adenovirus. For 3–4 days after tail vein injection of virus, mice were fed ad libitum and then fasted for 16 h before being sacrificed. (D) Blood glucose levels measured from mice treated as in (A). (E–G) Hyperinsulinemic-euglycemic clamp data from db/db mice injected with GFP or 3×FLAG WT Sirt6 virus. Clamped glucose infusion rate (E), glucose uptake (F), and hepatic glucose production (G) are shown. (F) Hepatic levels of endogenous Sirt6 mRNA in GFP-infected control mice treated as in (A). (G) Hepatic levels of endogenous Sirt6 protein in GFP-infected control mice treated as in (A). In Figures (A–D), results are data pooled from two independent experiments; N=15 for GFP injected +/db mice, N=10 for Sirt6 injected +/db mice, N=13 for GFP injected db/db mice, N=12 for Sirt6 injected db/db mice. In Figures (E–G), data are from 6-GFP injected and 7-Sirt6 injected mice and analyzed by a two-tailed unpaired t-test. (J) A model for how Sirt6 is able to regulate the acetylation state of PGC-1α and the gluconeogenic program of hepatoctyes. Left—when hepatic Sirt6 activity is low, GCN5 is acetylated at K549 and residues Ser307 and Thr735 are unphosphorylated. In this state, GCN5 activity is low. This, coupled with the action of Sirt1, results in low levels of PGC-1α acetylation, high levels of PGC-1α activity, and an activation of gluconeogenic gene expression. Right—when hepatic Sirt6 activity is high, GCN5 is deacetylated at K549 and residues Ser307 and Thr735 are phosphorylated. In this modified state, GCN5 activity is enhanced and exceeds the rate of Sirt1-mediated deacetylation, resulting in high levels of PGC-1α acetylation, reduced levels of PGC-1α activity, and a decrease in gluconeogenic gene expression. See Figures S6,7 and Table S1.

