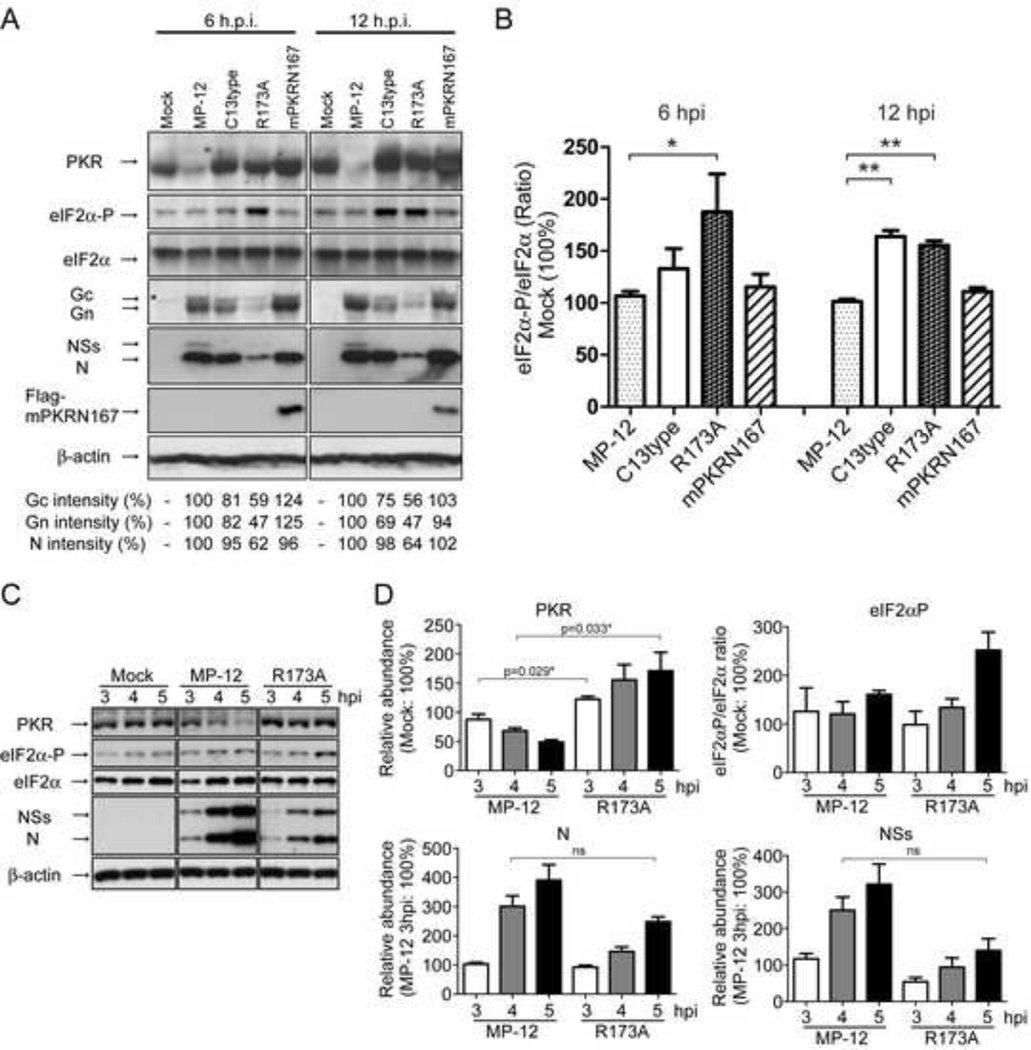
Fig. 2. Status of eIF2α and viral translation in MEF cells.
MEF/wt cells were mock-infected or infected with indicated viruses at an moi of 3, and the cell lysates were harvested at indicated time points, and Western blotting was performed to detect indicated protein accumulations. (A) Abundance of PKR, eIF2α, phosphorylated eIF2α (Ser51), viral N and NSs proteins, Flag-mPKRN167, and β-actin in cells mock-infected or infected with MP-12, rMP12-C13type (C13type), rMP12-NSsR173A (R173A), or rMP12-mPKRN167 (mPKRN167) at 6 and 12 hpi. Signal intensity of viral proteins (N, Gn and Gc) in cells infected with MP-12 was used as the scale to measure the others and considered 100%. Asterisk (*) represents a nonspecific band. (B) The relative abundance of phosphorylated eIF2α at 6 and 12 hpi. The density of phosphorylated eIF2α normalized to total eIF2α in mock-infected cells is represented as 100%. Asterisk represents statistical significance (unpaired t-test, *p<0.05, **p<0.01). (C) Abundance of PKR, eIF2α, phosphorylated eIF2α (Ser51), viral N and NSs proteins and β-actin in cells mock-infected or infected with MP-12, rMP12-NSsR173A (R173A) at 3, 4 and 5 hpi. (D) The relative abundance of PKR, phosphorylated eIF2α, N and NSs in cells infected with MP-12 or rMP12-NSsR173A at 3, 4 and 5 hpi. The density of PKR, phosphorylated eIF2α (normalized to total eIF2α) in mock-infected cells, or that of N or NSs in MP-12-infected cells at 3 hpi were represented as 100% for PKR, eIF2αP, N or NSs, respectively. Asterisk represents statistical significance (unpaired t-test, *p<0.05, ns; not significant). In B and D, means +/− standard deviation of three independent experiments are shown as a graph, while representative data of three independent experiments are shown in A and C.

