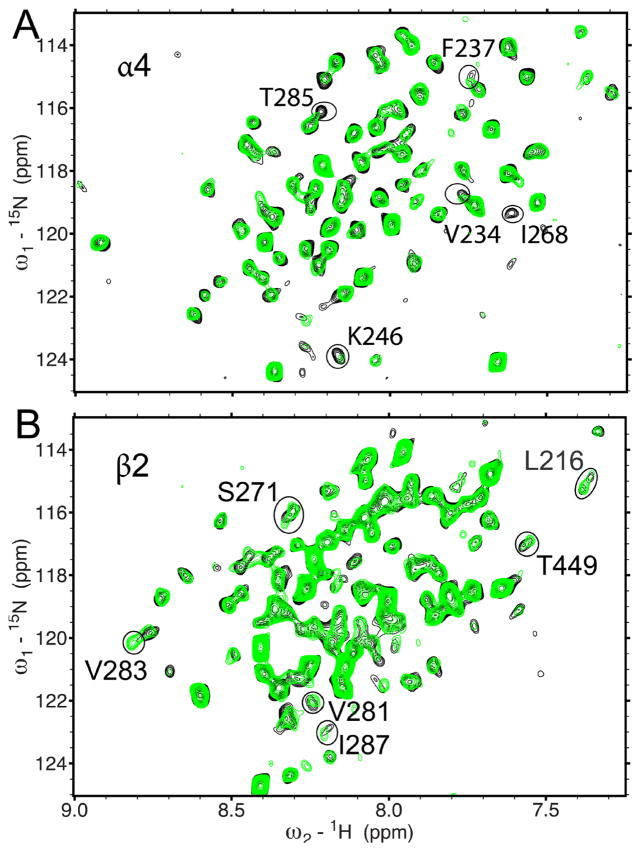
Fig. 3.
Residues involved in ketamine binding using 1H-15N TROSY-HSQC spectra of the transmembrane domain of the human α4β2 n-acetylcholine receptor in the absence (black) and presence (green) of 80 μM ketamine. (A) α4(β2), where only α4 is 15N-labeled; (B) β2(α4), where only β2 is 15N-labeled. For clarity, the chemical shift assignment for each peak is omitted here but provided in the Supplementary Material (Figs. S4 and S5). Peaks displaying significant changes in chemical shift are circled.

