Figure 2.
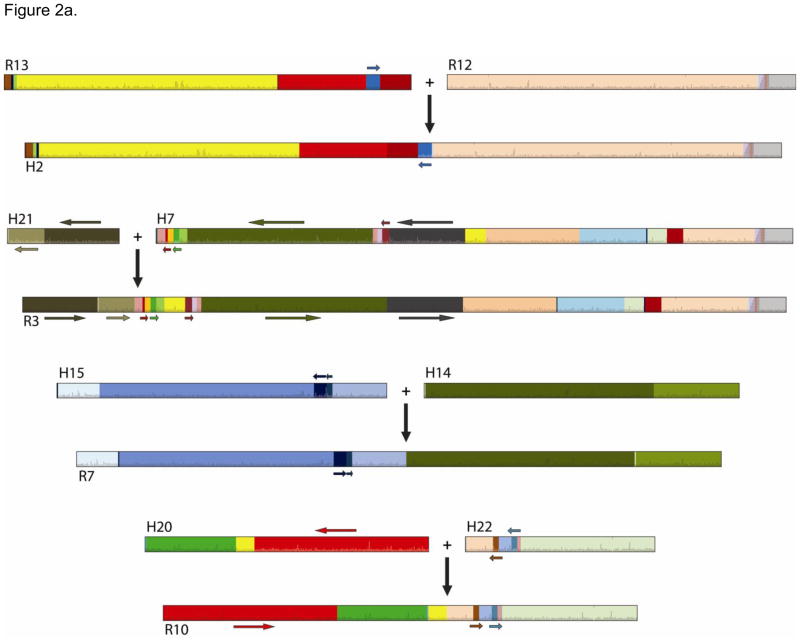
Figure 2a. Associations among rhesus chromosomes and human chromosomes. Colors and horizontal arrows represent syntynic order and opposite directionality of heterospecific SNPs and vertical arrows denote chromosome fusion.
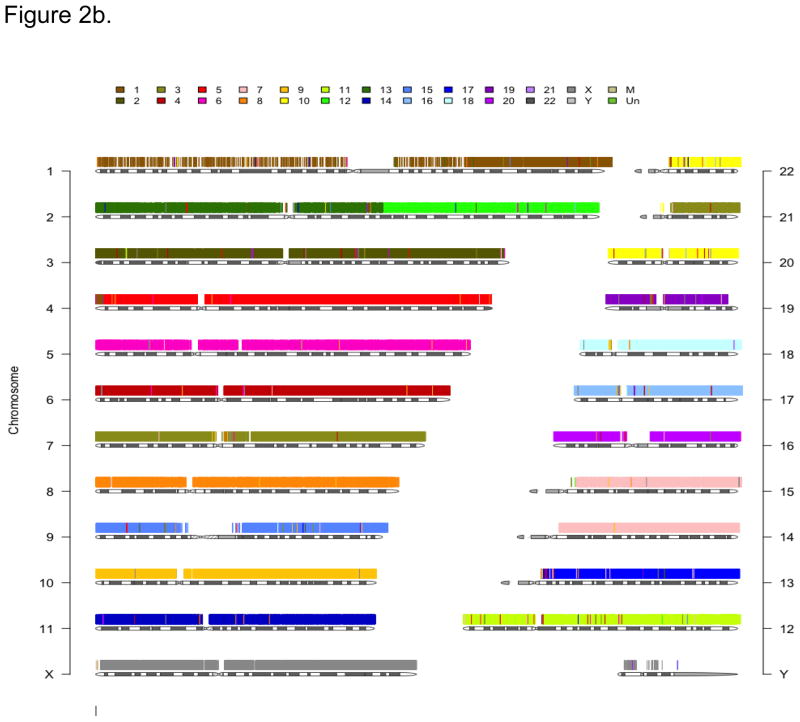
Figure 2b. A generalized image of conserved synteny of the rhesus macaque reference genome (RheMac2) chromosomal segments (colored) relative to the 23 human (HG19) chromosomes. Note that the absence of SNP probes in either species marks the approximate locations of centromeric regions. Colored vertical bars represent heterospecific SNPs within the conserved probes.
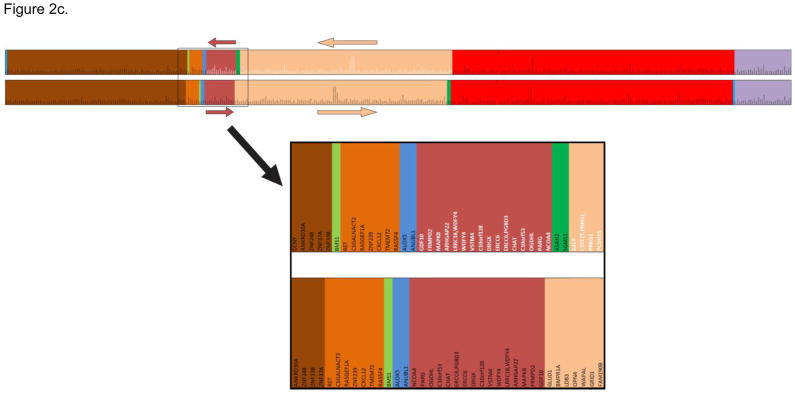
Figure 2c. Gene orthologs on rhesus macaque chromosome 9 and human chromosome 10 revealed by single-hit heterospecific SNPs. The bars are the conserved gene orthologs. The colored blocks define the conserved gene orders in both species; black font indicates human and rhesus macaque gene orders that are in the same direction, and white font highlights inverted gene orders (Top). An overlapping section of the human and rhesus chromosomes is magnified (Below).


