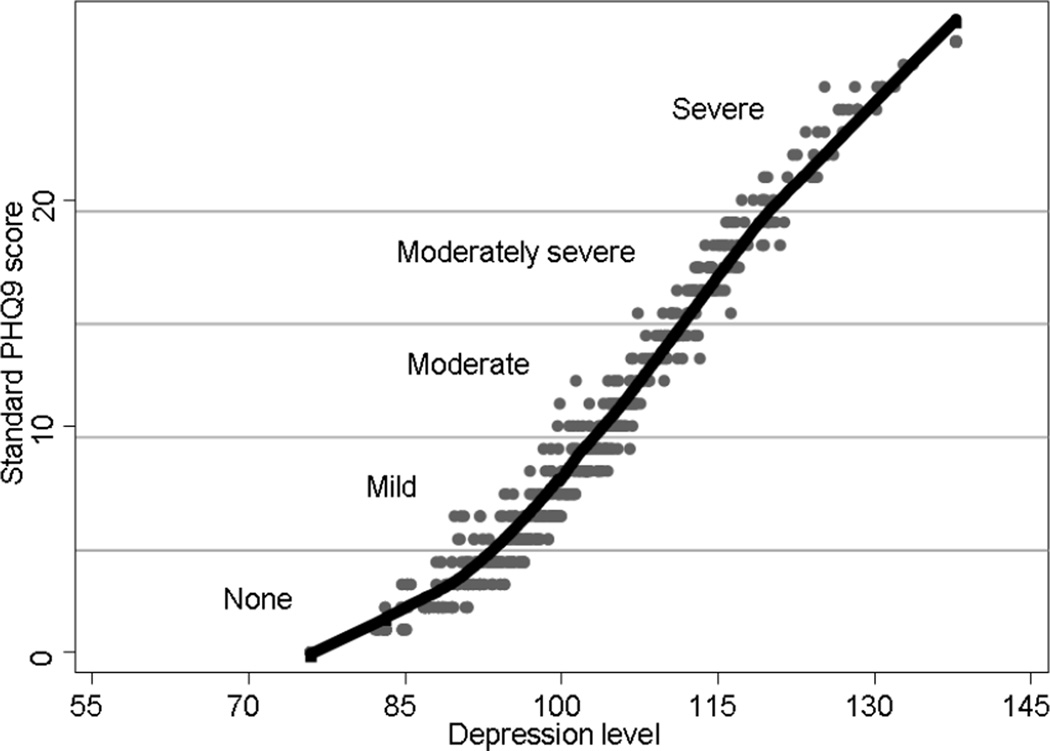
Figure 2.
Scatter plot and lowess curve of IRT depression scores with standard PHQ-9 scores*
* This graph shows the range of depression levels associated with each standard PHQ-9 score in the scatter plot with gray dots. Depression severity categories based on standard PHQ-9 scores are also shown. In IRT scoring, unlike standard scoring, items may receive unequal weight. Endorsing a particular frequency of a more severe depression symptom results in a higher depression severity score than endorsing the same frequency of a less severe depression symptom. For example, consider individuals with standard PHQ-9 scores of 15 (the bottom row of the “Moderately severe” category). IRT depression severity scores for these individuals range from 107 to 116, suggesting some variability in the severity of depression masked by equal weights applied to each item in the standard PHQ-9 scores. The range of IRT depression severity scores associated with each standard PHQ-9 scores varies from a single value (at the minimal and maximal values of 0 and 27 points) to a 10 point range (at standard scores of 7 points). The 10 point range represents 2/3 of a standard deviation.
The black lowess curve shows a curvilinear relationship between standard scores and the level of depression. For these reasons, we chose to use the IRT depression score rather than the standard PHQ-9 score in our regression analyses.

