Abstract
AFM images show that chromatin reconstituted on methylated DNA (meDNA) is compacted when imaged under water. Chromatin reconstituted on unmethylated DNA is less compacted and less sensitive to hydration. These differences must reflect changes in the physical properties of DNA on methylation, but prior studies have not revealed large differences between methylated and unmethylated DNA. Quasi-elastic light scattering (QELS) studies of solutions of methylated and unmethylated DNA support this view. In contrast, AFM images of molecules at a water/solid interface yield a persistence length that nearly doubles (to 92.5±4 nm) when 9% of the total DNA is methylated. This increase in persistence length is accompanied by a decrease in contour length, suggesting that a significant fraction of the meDNA changes into the stiffer A form as the more hydrophobic meDNA is dehydrated at the interface. This suggests a simple mechanism for gene silencing as the stiffer meDNA is more difficult to remove from nucleosomes.
Introduction
The genes of higher eukaryotes are selectively silenced by methylation of DNA,1, 2 a process essential for normal development,3 while aberrant methylation is associated with cancer.4, 5 The recruitment of methyl-binding protein undoubtedly plays a role in compacting chromatin in regions of methylated DNA (meDNA) and consequentially, in reducing access for transcription factors.6 An earlier AFM study found no differences between images of chromatin reconstituted on meDNA and unmethylated DNA templates,7 though small differences were found when histone H1 was added. Taken together, these observations imply that there are no large differences in chromatin structure caused by DNA methylation in the absence of binding by other proteins. On the other hand, single-molecule FRET studies of DNA dynamics on mononucleosomes8 showed that DNA methylation reduces opening fluctuations substantially. This implies that methylation changes the mechanical properties of DNA. Studies of the mechanical properties of meDNA are somewhat contradictory, but generally suggest small increases in persistence length on methylation.9–14 A recent AFM study suggests that a more significant stiffening is possible.15 Here, we show how the presence of a water/solid interface plays a role in this effect. The differences between methylated and unmethylated DNA in solution are probably not large, but become amplified when DNA is located at an interface, where the hydrophobic methyl groups can interact with the surface to exclude water and drive the DNA into a more tightly wound (and hence stiffer) conformation. In the work reported here, the interface is between water and a mica substrate used for AFM imaging, but clearly the same forces can come into play at the interface between DNA and proteins, including the histone proteins in nucleosomes, or the ligases used in assaying stiffness by means of circularization.
Experimental Methods
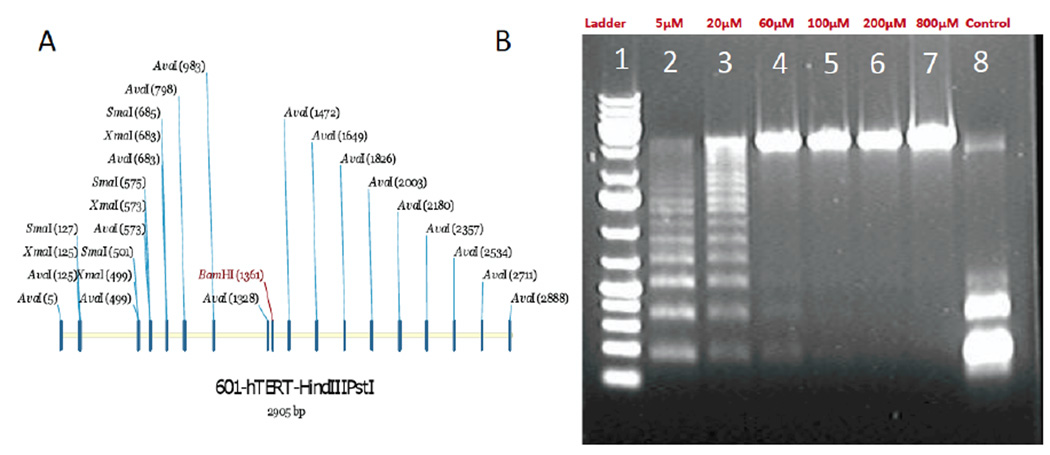
The DNA template was a 2905 bp concatenation of the hTERT promoter and a series of nine repeats containing the 601 nucleosome positioning sequence. The sequence contains 951 cytosines (32.2% C content) and 259 occurrences of the 5’CG3’ motif (the site of most rapid methylation of the C by DNA methyl transferase16) on one strand. Thus, when fully methylated, about 9% of all bases are 5-methylC. The full sequence is given in the supporting online information, together with details of its preparation and isolation. 1 µg of the DNA template in 1/10 PBS (15 mM NaCl/1mM phosphate buffer, pH = 7.0) was added to s-adenosine methionine (SAM, typically 800 µM final concentration) followed by the addition of 10 units of CpG Methyltransferase (M.SssI) (New England Biolabs catalogue no. M0226L) and 2 µl NEB buffer 2 (New England Biolabs catalogue no. 87002s). The mixture was diluted to 20 µl final volume and incubated at 37°C overnight. This procedure resulted in full methylation. For partial methylation, SAM was added in lower concentrations (down to 5 µM). Methylated DNA was purified by running on a 0.8% Agarose gel for 1 hr in TAE buffer and extracting it from the gel. The degree of methylation was quantified using Ava 1 digestion. Figure 1A shows the location of Ava1 digestion sites (5’CYCGRG3’) access to which is blocked by cytosine methylation. Samples were digested with Ava1 restriction enzyme (New England Biolabs) by incubating at 37°C for 2 hrs. The digest was run on a 0.8% Agarose gel. Control DNA was fully digested but fully methylated DNA was not digested at all. The extent of methylation can be quantified using the distribution of lengths following digestion, as shown in Figure 1B. These distributions are quite sensitive and, by matching them to simulations (online supporting information) the degree of methylation can be determined to within ±5%. Methylation is quoted in terms of the fraction of Ava1 sites that are methylated because that is what is measured. 100% corresponds to methylation of about 9% of all bases in the sequence.
Figure 1.
The 2905 bp DNA template (A) showing Ava1 restriction sites. The sequence contains 951 cytosines (32.2% C content) and 259 occurrences of the 5’CG3’ motif (the target for CpG Methyltransferase) on one strand. (B) Ava1 digests of DNA incubated with CpG Methyltransferase overnight in the presence of 5 (lane 2) to 800 (lane 7) µM S-adenosinemethionine (SAM). The digest of untreated DNA is shown in lane 8. Fits to the observed ladders permit calculation of the degree of methylation as described in the supporting online information.
Nucleosomal arrays were reconstituted by step salt dialysis17 using histones extracted from chicken erythrocytes. Reconstitution of both methylated and umethylated samples was carried out side by side using the same protein solutions to remove variability owing to loading of the nucleosomal arrays. The DNA and histone mixture were incubated on ice for 30 – 45 min at a ratio of 1 to 1.5 (w/w) in 1xTE buffer (10mM Tris at pH 7.5, 1mM EDTA) to reach a final DNA concentration of 100ng/µl, DTT at 1mM and NaCl at 1M. This solution was further subjected to step wise dialysis into 1M, 0.8M, 0.6M and 0.15 M NaCl solution in 1X TE buffer. The final reconstituted sample after 0.15M NaCl dialysis was dialyzed against 0.25mM TE (pH 7.5) buffer overnight. All these steps were carried at 4°C. Isolated reconstituted samples were crosslinked with 0.1% Glutaraldehyde for imaging in AFM.
Freshly cleaved mica surfaces were treated with a solution of 10mM Mg++, immediately followed by deposition of chromatin samples (DNA concentration = 1 ng/µl). The samples were incubated on the mica surface for 2 min and then washed gently with distilled water and submerged under 1/10 PBS for imaging. We used Veeco silicon nitride probes (Veeco, Plainview NY) with a spring constant of 0.1 N/m. They were coated for MacMode operation (Agilent Technologies, Chandler AZ) and driven at a peak to peak amplitude of 8 to 9 nm. Images were acquired at 1.5 lines/second.
AFM measurements on DNA alone were taken in air. The Mg treated mica was dried in nitrogen after exposure to a 1 ng/µl DNA solution in 1/10 PBS. The imaging was done on a 5500 AFM from Agilent Technologies using Si3N4 cantilevers with spring constants ranging from 25–75N/m, resonating at around 300 kHz.
Multiangle quasi-elastic light scattering (QELS) data were collected at 25°C at angles ranging from 26° to 100°, using a Peltier temperature-controlled Wyatt Technology Dawn Heleos II instrument, equipped with an external connection to a DynaPro NanoStar multi-tau correlator with a 100 ns sampling time, a 658 nm, 120 mW GaAs linearly polarized laser and a 70 µl fused silica flow cell. A Razel R99-EJ syringe pump system was used to deliver small sample volumes into the flow cell minimizing introduction of air bubbles. The system was initially calibrated with toluene to obtain absolute scattered intensities at 90°. At each angle, the fiber optic coupling was optimized by maximizing the scattered intensity of buffer. 1 mg/mL bovine serum albumin (BSA) in 1/10 PBS was then injected as a control and to normalize photodiodes to 90°. Finally, 200μL of 0.03–0.06 mg/mL of the DNA sample were injected for QELS data collection. Data were partially analyzed using Wyatt Technology ASTRA software and exported into MatLab for angle dependent analysis.
DNA sample concentrations (0.06 mg/ml unmethylated DNA and 0.03 mg/ml methylated DNA) were chosen to ensure dilute conditions while yielding scattering intensities at least 10 times larger than buffer at 90° and an autocorrelation function amplitude greater than 1.2. Because the presence of small amounts of dust particles, air bubbles and possible aggregates can greatly affect the signal at low angles, data filtration procedures were applied. At each angle, individual autocorrelation functions were acquired for short 5 second intervals for a total time of 4–10 minutes, and correlation functions that did not meet specific criteria were rejected (the total acquisition time was limited by eventual leakage of sample from the flow cell, due to the small sample volumes used). Initially, a consecutive time window in which scattered intensities did not exceed 10% of the average was selected. Within this time window individual correlation functions with baselines greater than 1.01 were rejected. This resulted in an effective acquisition time of 0.8–7.1 min, corresponding to a minimum of 9 correlation functions per angle. These correlation functions were averaged and fit to a cumulant algorithm (apparent polydispersity caused deviations from single exponential decay and the signal to noise ratio was insufficient for reliable regularization fits). Data sets, best fit functions and fitting parameters provided by ASTRA software for each angle were exported into MatLab for further processing.
Results and Discussion
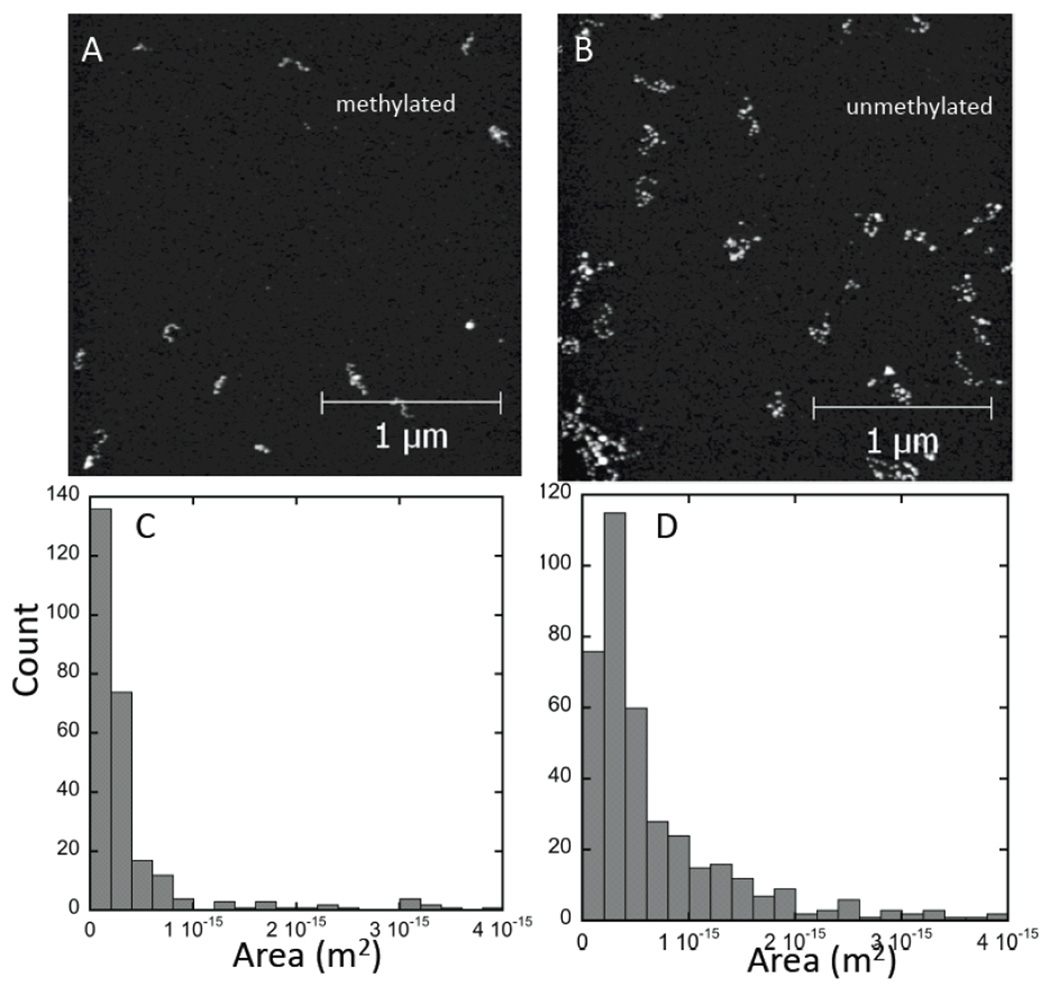
AFM images of chromatin reconstituted on methylated (fully methylated, i.e. 9% of the sequence) and unmethylated DNA are strikingly different as shown in Figures 2A and 2B. These images were obtained with the samples fully hydrated, submerged in 1/10 PBS. The unmethylated samples show arrays of clearly separated nucleosomes while separated nucleosomes are not frequently observed in the methylated samples. These differences are quantified in histograms of the surface area occupied by each of the clusters in the images (Figures 2C and 2D). These differences are not a consequence of different nucleosomal loading of the arrays. The arrays were reconstituted using the same protein solutions and the loading was quantified by measuring the volume of the imaged arrays, a useful measure of the histone/DNA ratio since the components (DNA and histone protein) are relatively incompressible. The volumes occupied by the arrays are essentially identical (supporting online information).
Figure 2.
Images of nucleosomal arrays reconstituted on meDNA (A) and control DNA (B) at the same nucleosome loading and imaged under 1/10 PBS. Individual nucleosomes are clearly observed in B but only infrequently in A where arrays are more tightly clustered. Histograms of the area occupied by each array for meDNA (C, N=265) and the control DNA (D, N=393) quantify this compaction.
AFM images of chromatin taken in air do not show this sensitivity to methylation.7 While samples imaged in air undoubtedly retain tightly bound water, the hydrophobic interaction is strong, and long range, with a decay length of ~1nm18 so the presence of bulk water is probably critical when a complex sample like chromatin is imaged.
These observations are consistent with the FRET studies of Choy et al.8 which show that DNA is more tightly bound to histones in mononucleosomes. At first sight this is inconsistent with the observation that nucleosome assemble with less frequency on methylated DNA14 but, as we shall show, meDNA changes on contacting an interface while unmethylated DNA does not (at least to the same degree). Thus, it is perfectly possible that methylated DNA is both somewhat stiffer (and therefore less likely to assemble into a nucleosome) yet more strongly retained within a nucleosome once it is formed.
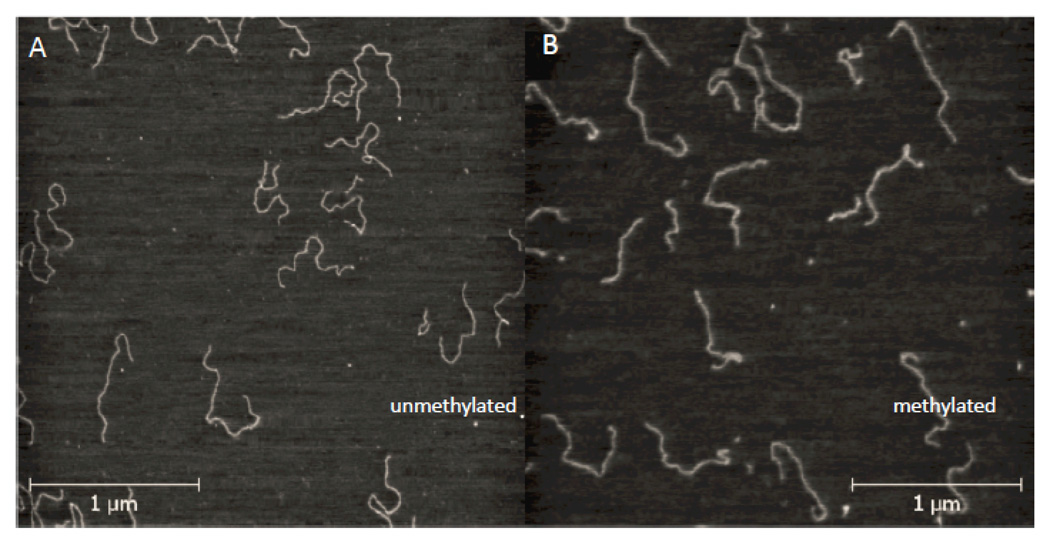
We used AFM imaging to investigate differences in the DNA template as a function of methylation. Images of unmethylated and fully methylated (i.e., 9% of all bases) templates imaged on Mg treated mica are shown in Figures 3A and 3B. The methylated DNA appears “stiffer” in as much as the contours (Fig. 3B) lack the rapid fluctuations seen at short distances in the control (Fig. 3A). In this case, differences between the two samples are apparent in images taken in air (in contrast to the larger chromatin arrays where bulk hydration was required to observe differences). We quantified these differences using a custom Matlab program to locate and follow the DNA contours in the AFM images, and fitted them to the wormlike chain model, checking that the contours followed an equilibrium distribution19 (supporting online information). Providing that the DNA has equilibrated on the surface, the persistence length, ξ, follows from fitting the averages of the cosine of the angles, θ, between line segments taken along the contour at distances s, and s+L to the following distribution:20
| (1) |
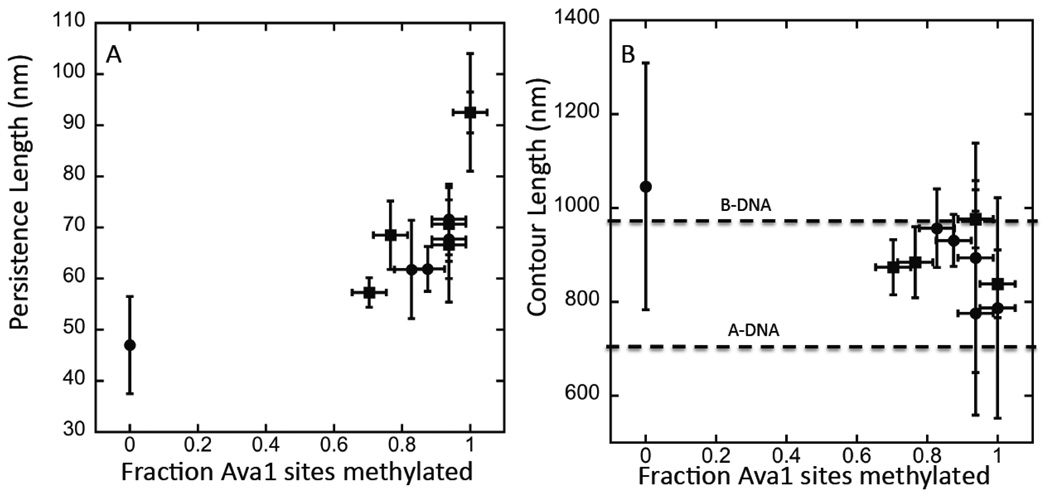
The persistence length of the unmethylated material measured in this way is 47±9.5 nm, in line with the commonly reported value of 50 nm.14 It begins to rise (Figure 4A) when half the possible sites are methylated, reaching 92.5±4 nm when the sample is fully methylated (ie., 9% of all bases). These are the first such measurements taken over a range of methylation of the same sequence. These data are consistent with the results of Wanunu et al.15 who reported persistence lengths for full methylation of a sample of a somewhat lower 5’CG3’ content. In that case persistence lengths in the range of 50 to 65 nm were reported. Insight into a mechanism of this apparent stiffening is found in measurements of the contour lengths (Figure 4B).
Figure 3.
Images of control DNA (A) and meDNA (B) on Mg-treated mica. The meDNA contour fluctuates less rapidly.
Figure 4.
Persistence length vs. the degree of methylation (A) derived from AFM images like those shown in Figure 3. Data from two different preparations are shown (circles and squares). The degree of methylation was different for a given concentration of SAM in the two preparations, but the data line up well when the degree of methylation is calibrated using an Ava1 digest. Uncertainties in both the enzyme treatment and the analysis of the degree of methylation make it difficult to get data below about 0.6 of available sites (i.e., 5% of bases) methylated. Error bars are ±1 sd on the measured distributions. 60 to 100 molecules were analyzed for each data point. (B) shows contour lengths measured for the same set of molecules. The two dashed lines mark the expected contour lengths for B- and A-DNA respectively. The length distributions are broad owing to variations in the interactions with the mica substrate, but there is a clear trend towards a shortening of the contour length with increasing methylation.
The contour length decreases with increasing methylation, falling from 1046 nm to 787 nm. This corresponds to a rise per base of 0.35 nm (unmethylated) falling to 0.26 nm (fully methylated). 0.35 nm is close to the rise per base for the normal B-form of DNA (0.34 nm). 0.26 nm is closer to the rise per base for the dehydrated A-form (0.24 nm). While it is well-known that methylation can drive CG rich DNA into the Z form at high salt,21 Z DNA is extended relative to B DNA (rise per base = 0.37 nm) so this would not account for the observed contraction. Indeed, in solution, cytosine methylation stabilizes the B-form against the A-form.22 On the other hand, both dehydration and contact with a surface are known to drive the B to A transition.23 The more tightly wound helix of A DNA is considerably stiffer than B-DNA. For example, the persistence length of A-DNA dehydrated in trifluoroethanol is 150 nm.24 Thus, a transition of substantial regions of the polymer into A DNA on contacting the surface would account for the observed stiffening of the methylated DNA on nucleosomes.8 In contrast, the unmethylated DNA is clearly hydrophilic enough to retain its hydration, and thus maintain the more flexible B form on the mica surface.
Previous measurements of the persistence length of methylated DNA all appear to have involved interactions with surfaces, either substrates for AFM imaging15 or measurements of ligation frequency (where the ligase can play the role of a supporting interface).9–11, 14 For this reason, we carried out angle-resolved QELS of solutions of methylated and unmethylated DNA. The persistence length cannot be obtained with great accuracy from such measurements, but large changes should be detectable.
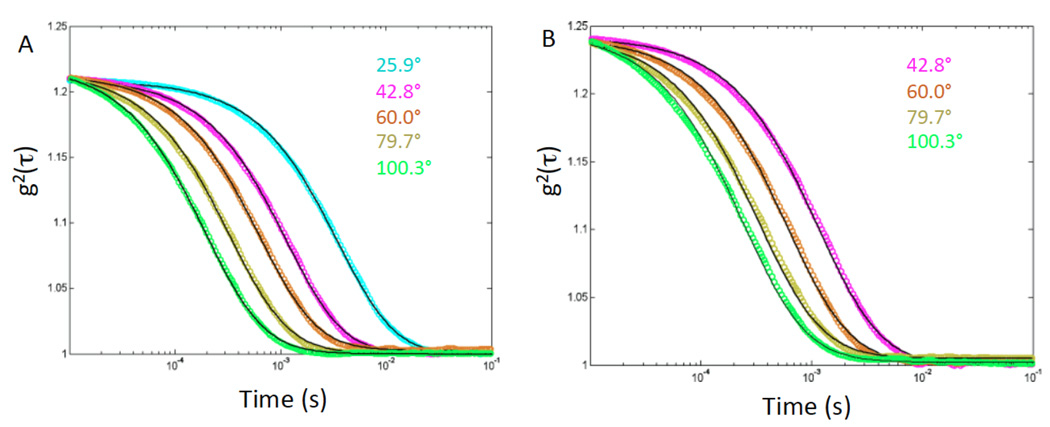
Figure 5 shows the second order correlation function, g2(q,τ), of the scattered field, I(t), as a function of delay time, τ, where
| (2) |
and q is the scattering vector, obtained from the scattering angle, θ, light wavelength, λ, and refractive index of the solvent, n, via
| (3) |
Figure 5.
QELS data for the second order intensity correlation function, g2(q,τ) as a function of delay time, τ, for control DNA (A) and meDNA (B) for the scattering angles as marked. The solid lines are cumulant fits using a single exponential with a Gaussian distribution of relaxation times, τR. The average value is used in subsequent analysis.
Our instrument allowed collection of signals over a range of angles from 25°to 100°, though data taken at the smallest angle were unusable for the fully methylated sample because of the presence of small aggregates of meDNA. The enhanced propensity of meDNA to aggregate was confirmed by taking AFM images of solutions of control samples and meDNA in the presence of small amounts of DMSO (data not shown).
Hydrodynamic radii reported by ASTRA at each angle were re-converted to raw correlation times τ, using the expression
| (4) |
where D is the diffusion constant of the molecule which is given by
| (5) |
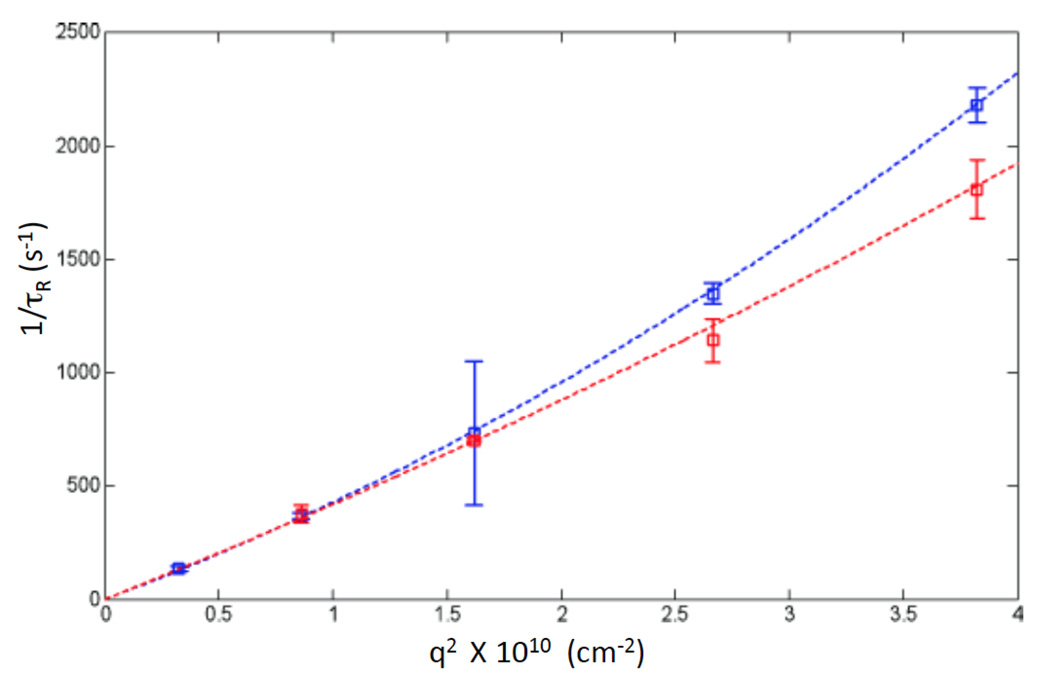
where η is the solvent viscosity, yielding τ= (6πηrh)/(q2kBT). These values were used to create plots in Figures 5 and 6. To calculate the error, each time window selected for analysis was split into 5 equal time intervals. The correlation time τ, was calculated for each data slice from the reported hydrodynamic radius and the error calculated as the standard deviation of the mean. Because the hydrodynamic radius does not scale linearly with the persistence length, ξ, (Equation 6), errors on ξ were determined by calculating ξ for the upper and lower bounds of rH. For correlation times due to pure translational diffusion (i.e. in the absence of rotational diffusion or internal motions) τ =((D*q2)−1), where D is the diffusion coefficient, related to the hydrodynamic radius by the Stokes-Einstein relation (Equation 5). In the case of long polymers (e.g. DNA above 1Kbp) internal motions/rotational diffusion give rise to additional correlation relaxation times which can overlap with the translational correlation time at large angles.25 Plots of 1/τ versus q2 that deviate from linearity at high angles are a typical signature of this effect . In this case, the actual translational diffusion coefficient D is obtained by fitting 1/τ versus q2 data points to a second order polynomial and taking the slope at q=0 (zero angle extrapolation), as in Figure 6. Data in Figure 6 were fit to a second order polynomial of the form y=ax2+bx and D was calculated from the best fit coefficient b. Error on the diffusion coefficients were taken from the 95% confidence interval of the fitting.
Figure 6.
Inverse relaxation time plotted versus the square of the scattering vector for meDNA (red data points) and control DNA (blue data points). Departure from linearity, owing to internal fluctuations, is most evident for the control DNA. The lines are fits to a quadratic in q2. The coefficient of the linear term (in q2) is the diffusion constant for the molecule.
Both sets of data converge at small values of q as expected25 yielding D=3.97±0.61×10⁻⁸ cm2s−1 for meDNA and 3.76±0.44×10⁻⁸ cm2s−1 for the control DNA. The essentially equal diffusion constants indicate equal sizes for the molecules, and thus equal persistence lengths for the two types of DNA in solution. Note, however, the smaller departure of meDNA from ideal behavior (red dashed line) indicates less structural fluctuation, consistent with molecular dynamics simulations that show that methylation leads to suppression of such fluctuations.13, 14
These results can be compared to our data for persistence length via the ratio of the hydrodynamic radii for the two molecules. The Stokes-Einstein relation (Equation 5) yields the hydrodynamic radii, rh. Given that the radius of gyration, rG, and the hydrodynamic radius are related by a constant factor,25 the light scattering results yields the ratio of the radii of gyration of the methyalted molecule to that of the control molecule as
where the uncertainty in this ratio is calculated from taking the largest possible value for one of the diffusion constants and the smallest possible value for the other.
In the worm-like chain model 25 the radius of gyration and persistence length are related by
| (6) |
where LC is the contour length of the molecule. Circular dichroism measurements show that methylated DNA remains in the B form (until very high salt concentrations where it can become Z-form22, 26) so LC=988 nm for both cases. Taking the control DNA to have a persistence length of 50 nm and the methylated DNA to have a persistence length of 92.5±4 nm and using equation 6 yields
Thus, although the hydrodynamic radius is rather insensitive to changes in persistence length, the difference between the light scattering result in solution and the AFM result on a surface is significant. The large persistence length observed in the AFM measurements is unlikely to apply in solution, though the uncertainties in the light scattering data do not rule out the possibility of a somewhat larger persistence length for meDNA in solution, as suggested by many of the experimental results referred to earlier.
The inconsistency between results showing that nucleosomes form less readily on meDNA14 and yet are also more tightly bound by DNA8 can be resolved if there is a conformational change of meDNA on binding which stiffens it further. The light scattering results for the ratio of hydrodynamic radii, taken together with the lack of an observed conformational transition in solution (except at high salt22, 26) are evidence of a significant interfacial effect driving the stiffening of meDNA at the interface, an effect that would not occur for isolated DNA in solution. It is interesting to note that high resolution x-ray structures show that the methyl groups on cytosine interact strongly with water27, enough so that methyl-binding protein recognizes the hydration shell rather than the methyl group.28 However, this stabilization occurs when the DNA is in the A-form in a crystal27 so this result is not inconsistent with our AFM data.
An apparent doubling of the persistence length on methylation would imply a doubling of the bending energy of DNA wrapped around a histone octamer, and this additional energy penalty should reduce the frequency of nucleosome formation by ~e2 or about 70%. Measured reductions in the frequency of nucleosome formation on methylation are smaller than this (~30%14) suggesting that there are indeed additional compensating gains in the free energy of nucleosome formation when DNA is methylated. Indeed, such forces must be at play, as the increased hydrophobicity of meDNA will result in an effective force pushing it on to an interface.29 Quantification of this effect, and the relative change in stiffness of DNA on binding an interface (such as a histone octamer in a nucleosome) require further experimental and theoretical studies. Direct measurements of the force required to unpeel nucleosomes would be particularly revealing. Nonetheless, the present work suggests that the increased hydrophobicity of meDNA may make an important contribution to gene silencing.
Supplementary Material
Acknowledgements
We thank Christian Rankl for providing the Matlab code used to analyze the images and Karan Syal for suggesting the use of DMSO. This work was supported by the National Cancer Institute under grant number U54 CA143862.
References
- 1.Jones PL, Wolffe AP. Relationships between chromatin organization and DNA methylation in determining gene expression. Semin. Cancer Biol. 1999;9:339–347. doi: 10.1006/scbi.1999.0134. [DOI] [PubMed] [Google Scholar]
- 2.Bird A. DNA methylation patterns and epigenetic memory. Genes and Development. 2002;16:6–21. doi: 10.1101/gad.947102. [DOI] [PubMed] [Google Scholar]
- 3.Feil R, Khosla S. Genomic imprinting in mammals - an interplay between chromatin and DNA methylation? Trends Genet. 1999;15:431–435. doi: 10.1016/s0168-9525(99)01822-3. [DOI] [PubMed] [Google Scholar]
- 4.Esteller M. Cancer epigenomics: DNA methylomes and histone-modification maps. Nat. ReV. Genet. 2007;8:286–298. doi: 10.1038/nrg2005. [DOI] [PubMed] [Google Scholar]
- 5.Toyota M, Issa JPJr. CpG island methylator phenotypes in aging and cancer. Semin. Cancer Biol. 1999;9:349–357. doi: 10.1006/scbi.1999.0135. [DOI] [PubMed] [Google Scholar]
- 6.Jones PL, Veenstra GCJ, Wade PA, Vermaak D, Kass SU, Landsberger N, Strouboulis J, Wolffe AP. Methylated DNA and MeCP2 recruit histone deacetylase to repress transcription. Nature Genetics. 1998;19:187–191. doi: 10.1038/561. [DOI] [PubMed] [Google Scholar]
- 7.Karymov MA, Tomschik M, Leuba SH, Caiafa P, Zlatanova J. DNA methylation-dependent chromatin fiber compaction in vivo and in vitro: requirement for linker histone. FASEB Journal. 2001;15:2631–2641. doi: 10.1096/fj.01-0345com. [DOI] [PubMed] [Google Scholar]
- 8.Choy JS, Wei S, Lee JY, Tan S, Chu S, Lee T-H. DNA Methylation Increases Nucleosome Compaction and Rigidity. J. Am Chem Soc. 2010;132:1782–1783. doi: 10.1021/ja910264z. [DOI] [PMC free article] [PubMed] [Google Scholar]
- 9.Hodges-Garcia Y, Hagerman PJ. Investigation of the Influence of Cytosine Methylation on DNA Flexibility. J. Biol. Chem. 1995;270:197–201. doi: 10.1074/jbc.270.1.197. [DOI] [PubMed] [Google Scholar]
- 10.Nathan D, Crothers DM. Bending and Flexibility of Methylated and Unmethylated EcoRI DNA. J. Mol. Biol. 2002;316:7–17. doi: 10.1006/jmbi.2001.5247. [DOI] [PubMed] [Google Scholar]
- 11.Hodges-Garcia Y, Hagerman PJ. Cytosine Methylation Can Induce Local Distortions in the Structure of Duplex DNA. Biochemistry. 1992;31:7595–7599. doi: 10.1021/bi00148a022. [DOI] [PubMed] [Google Scholar]
- 12.Banyay M, Gräslund M. Structural Effects of Cytosine Methylation on DNA Sugar Pucker Studied by FTIR. J. Mol. Biol. 2002;324:667–676. doi: 10.1016/s0022-2836(02)01104-x. [DOI] [PubMed] [Google Scholar]
- 13.Severin PMD, Zou X, Gaub HE, Schulten K. Cytosine methylation alters DNA mechanical properties. Nucleic Acids Research. 2011 doi: 10.1093/nar/gkr578. [DOI] [PMC free article] [PubMed] [Google Scholar]
- 14.Perez A, Castellazzi CL, Battistini F, Collinet K, Flores O, Deniz O, Ruiz ML, Torrents D, Eritja R, Soler-Lopez M, Orozco M. Impact of Methylation on the Physical Properties of DNA. Biophysical Journal. 2012;102:2140–2148. doi: 10.1016/j.bpj.2012.03.056. [DOI] [PMC free article] [PubMed] [Google Scholar]
- 15.Wanunu M, Cohen-Karni D, Johnson RR, Fields L, Benner J, Peterman N, Zheng Y, Klein ML, Drndic M. Discrimination of Methylcytosine from Hydroxymethylcytosine in DNA Molecules. J. Am Chem Soc. 2011;133:486–492. doi: 10.1021/ja107836t. [DOI] [PMC free article] [PubMed] [Google Scholar]
- 16.Smith S, Kaplan B, Sowers L, Newman E. Mechanism of human methyl-directed DNA methyltransferase and the fidelity of cytosine methylation. Proc. Natl. Acad. Sci. (USA) 1992;89:4744–4748. doi: 10.1073/pnas.89.10.4744. [DOI] [PMC free article] [PubMed] [Google Scholar]
- 17.Bash R, Yodh J, Lyubchenko Y, Woodbury N, Lohr D. Population analysis of subsaturated 172-12 nucleosomal arrays by atomic force microscopy detects nonrandom behavior that is favored by histone acetylation and short repeat length. J. Biol. Chem. 2001;276:48362–48370. doi: 10.1074/jbc.M104916200. [DOI] [PubMed] [Google Scholar]
- 18.Israelachvili J, Pashley R. The hydrophobic interaction is long range, decaying exponentially with distance. Nature. 1982;300:341–342. doi: 10.1038/300341a0. [DOI] [PubMed] [Google Scholar]
- 19.Rivetti C, Guthold M, Bustamnte C. Scanning Force Microscopy of DNA deposited onto mica: Equilibrium versus kinetic trapping studied by statistical polymer chain analysis. J. Mol. Biol. 1996;264:919–932. doi: 10.1006/jmbi.1996.0687. [DOI] [PubMed] [Google Scholar]
- 20.Wiggins P, Nelson P. Generalized theory of semiflexible polymers. Phys Rev E. 2006;73:031906. doi: 10.1103/PhysRevE.73.031906. [DOI] [PubMed] [Google Scholar]
- 21.Temiz N, Donohue D, Bacolla A, Luke B, Collins J. The role of methylation in the intrinsic dynamics of B- and Z-DNA. PLoS One. 2012;7:e35558. doi: 10.1371/journal.pone.0035558. [DOI] [PMC free article] [PubMed] [Google Scholar]
- 22.Shchelkina AK, Minchenkova LE, Ivanov VI, Butkus VV, Ianulaĭtis AA. B-A and B-Z transitions in deoxyoligoduplexes containing 4- and 5- methylcytosine. Mol. Biol. (Mosk) 1988;22:1562–1570. [PubMed] [Google Scholar]
- 23.Lindsay SM, Lee SA, Powell J, Weidlich T, DeMarco C, Lewen GD, Tao NJ, Rupprecht A. The Origin of the A to B Transition in DNA Fibers and Films. Biopolymers. 1988;27:1015–1043. doi: 10.1002/bip.360270610. [DOI] [PubMed] [Google Scholar]
- 24.Charney E, Chen H-H, Rau DC. The flexibility of A-form DNA. Journal of Biomolecular Structure and Dynamics. 1991;9:353–362. doi: 10.1080/07391102.1991.10507917. [DOI] [PubMed] [Google Scholar]
- 25.Sorlie SS, Pecora R. A Dynamic Light Scattering Study of Four DNA Restriction Fragments. Macromolecules. 1990;23:487–497. [Google Scholar]
- 26.Behe M, Felsenfeld G. Effects of methylation on a synthetic polynucleotide: The B-Z transition in poly(dG.m5dC).poly(dG.m5dC) Proc. Natl. Acad. Sci. (USA) 1981;78:1619–1623. doi: 10.1073/pnas.78.3.1619. [DOI] [PMC free article] [PubMed] [Google Scholar]
- 27.Mayer-Jung C, Moras D, Timsit Y. Hydration and recognition of methylated CpG steps in DNA. EMBO J. 1998;17:2709–2718. doi: 10.1093/emboj/17.9.2709. [DOI] [PMC free article] [PubMed] [Google Scholar]
- 28.Ho KL, McNae IW, Schmiedeberg L, Klose RJ, Bird AP, Walkinshaw MD. MeCP2 Binding to DNA Depends upon Hydration at Methyl-CpG. Molecular Cell. 2008;29:525–531. doi: 10.1016/j.molcel.2007.12.028. [DOI] [PubMed] [Google Scholar]
- 29.Chandler D. Interfaces and the driving force of hydrophobic assembly. Nature. 2005;437:640–647. doi: 10.1038/nature04162. [DOI] [PubMed] [Google Scholar]
Associated Data
This section collects any data citations, data availability statements, or supplementary materials included in this article.


