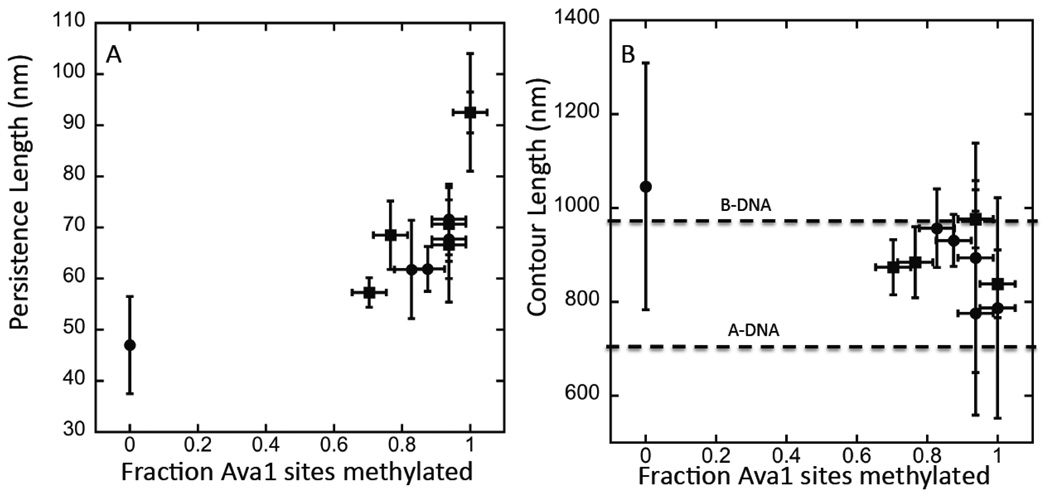
Figure 4.
Persistence length vs. the degree of methylation (A) derived from AFM images like those shown in Figure 3. Data from two different preparations are shown (circles and squares). The degree of methylation was different for a given concentration of SAM in the two preparations, but the data line up well when the degree of methylation is calibrated using an Ava1 digest. Uncertainties in both the enzyme treatment and the analysis of the degree of methylation make it difficult to get data below about 0.6 of available sites (i.e., 5% of bases) methylated. Error bars are ±1 sd on the measured distributions. 60 to 100 molecules were analyzed for each data point. (B) shows contour lengths measured for the same set of molecules. The two dashed lines mark the expected contour lengths for B- and A-DNA respectively. The length distributions are broad owing to variations in the interactions with the mica substrate, but there is a clear trend towards a shortening of the contour length with increasing methylation.

