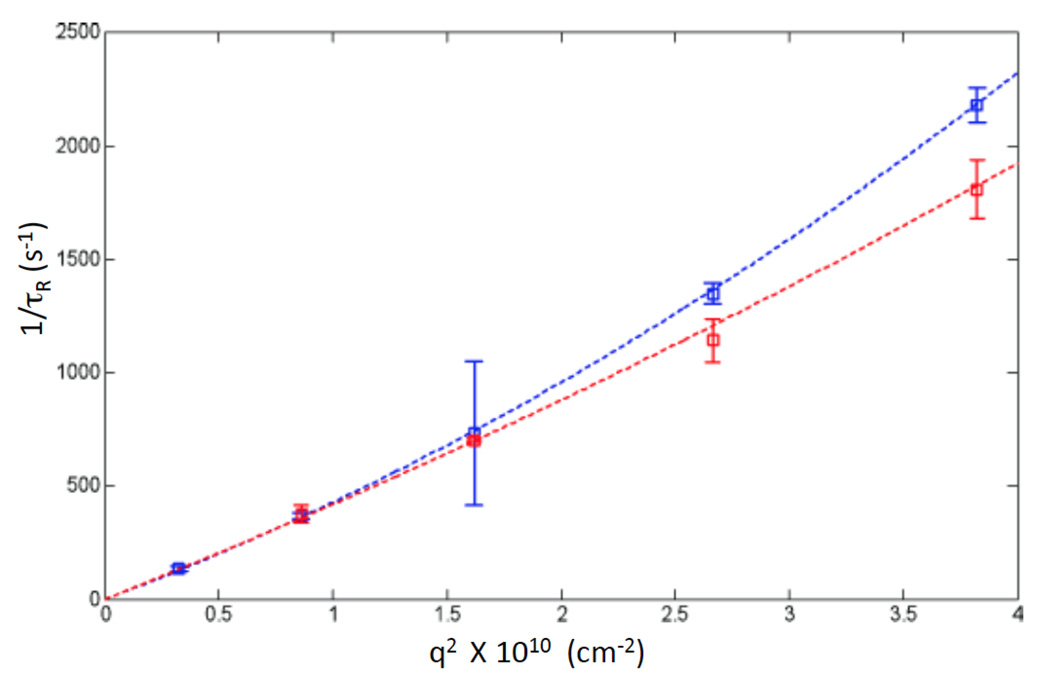
Figure 6.
Inverse relaxation time plotted versus the square of the scattering vector for meDNA (red data points) and control DNA (blue data points). Departure from linearity, owing to internal fluctuations, is most evident for the control DNA. The lines are fits to a quadratic in q2. The coefficient of the linear term (in q2) is the diffusion constant for the molecule.

