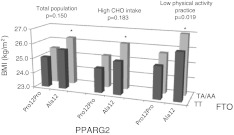
Fig. 1.
BMI differences according to genotype (dominant models for Pro12Ala and rs9939609 SNPs) for the three population groups (total population, only subjects with a high CHO intake or subjects with a low physical activity practice). Adjusted for sex, age, physical activity and total energy intake. *p < 0.05 between Ala12 + TA/AA and Pro12Pro + TT genotypes

