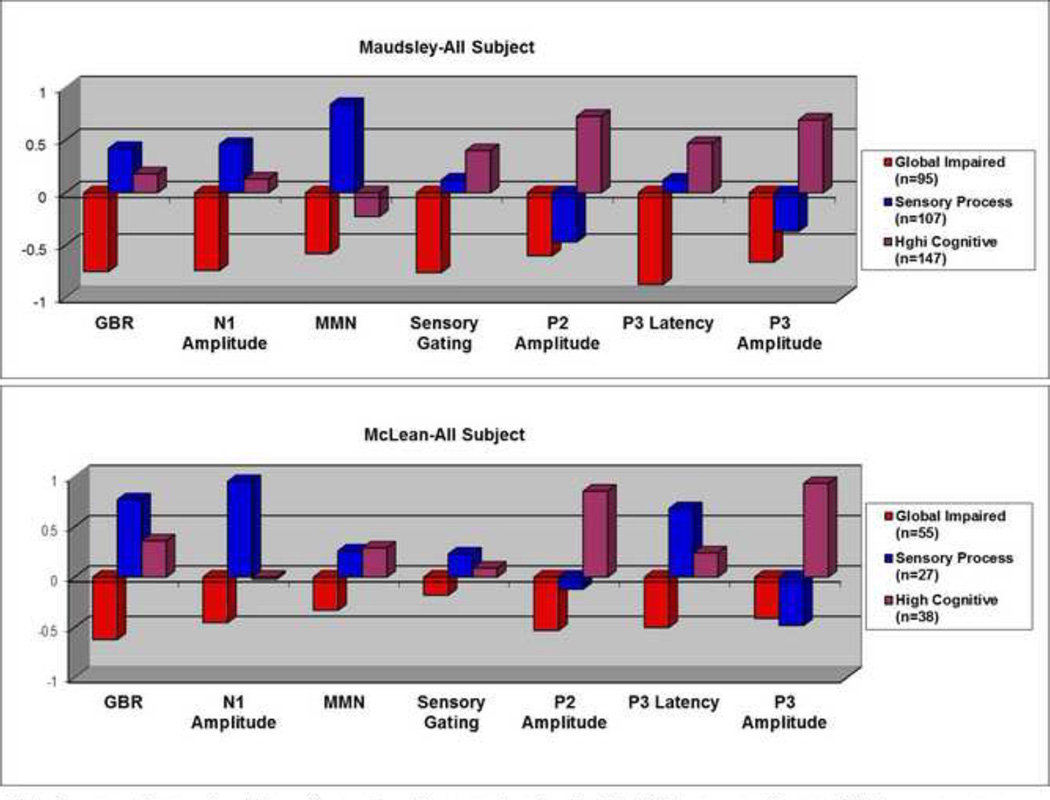
Figure 1.
Neurophysiological Profiles derived from All Participant Analysis
Note. For ease of comparison, the positive and negative score signs for the N1, MMN, sensory gating, and P3 latency measures were reversed so that positive values represent better performance and negative values represent worse performance.

