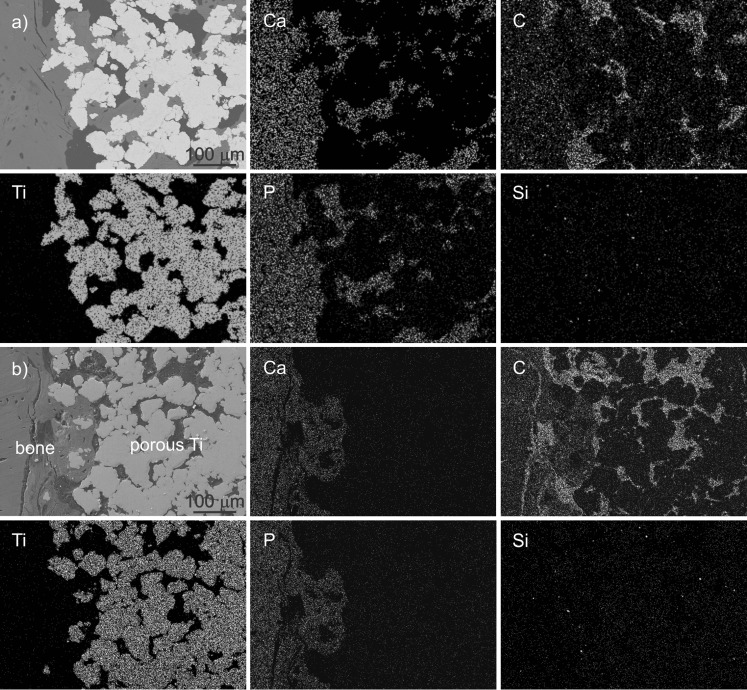
Fig. 4.
a Energy-dispersive X-ray analyses (EDXS) mappings of bone implant cross-sections for the sample with bioactive glass (BAG), showing from left to right on top: SEM image, Ca, C; bottom: Ti, P, Si. b EDXS mappings of the sample without BAG, showing from left to right on top: SEM image, Ca, C; bottom: Ti, P, Si

