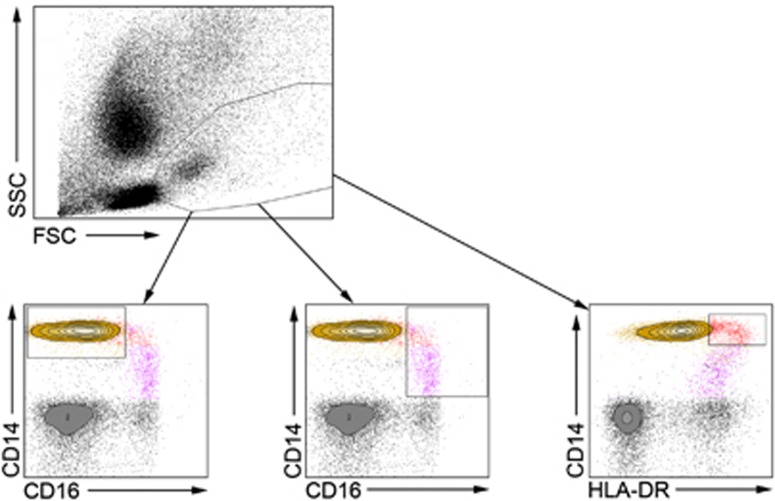
Figure 1.
Flow cytometry gating strategies. Representative flow cytometry plots showing the gating strategies used throughout the study for the CD14+CD16− (yellow; lower left), CD14loCD16+ (purple; lower middle), and CD14+HLA-DRhi (red; lower right) monocyte populations. The presented plots are from one representative inflammatory bowel disease patient.

