Fig. 2.

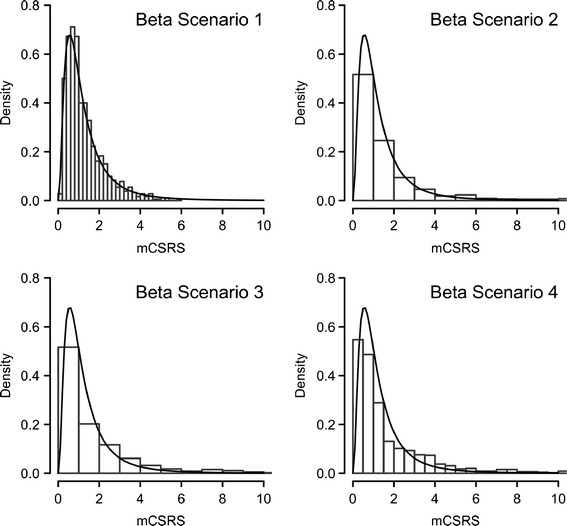
Comparison of distribution of the 900 mCSRSs (histogram) and F distribution with seven numerator and seven denominator degrees of freedom (solid line) for “beta scenarios” 1–4 and eight deposition sites, representative examples are displayed

Comparison of distribution of the 900 mCSRSs (histogram) and F distribution with seven numerator and seven denominator degrees of freedom (solid line) for “beta scenarios” 1–4 and eight deposition sites, representative examples are displayed