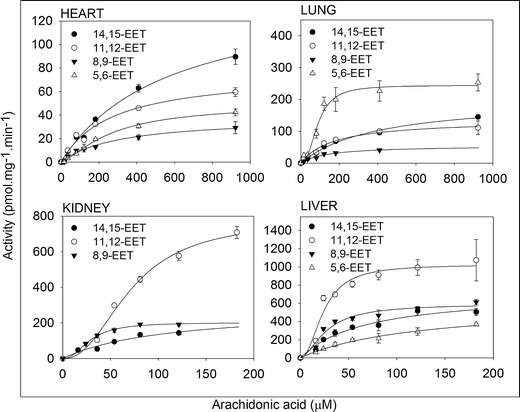
Fig. 2.

Kinetic profile of arachidonic acid metabolism by P450 epoxygenases in the heart, lung, kidney, and liver microsomal incubates. In a 200-μL total volume, 100 (heart and lung) and 200 μg (kidney and liver) of microsomal protein pooled from five rats were incubated with arachidonic acid for 30 min for heart and lung and 15 min for kidney and liver. The experimental values for arachidonic acid metabolism were expressed as mean ± SEM. Each point was measured in triplicate
