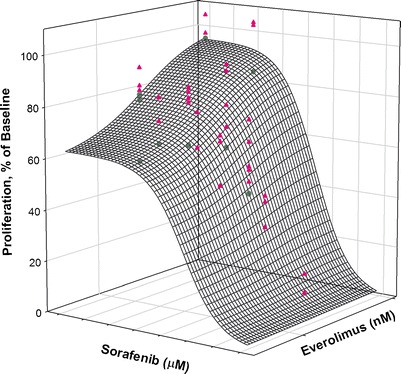
Fig. 3.

Fitted response surface using the modified Earp method with drug combination data for MiaPaCa-2 cells. The mesh surface is the model prediction for a value of Ψ = 1.48, which is the value derived by analysis of the data. The triangles are data above the surface, and the circles are data below the surface
