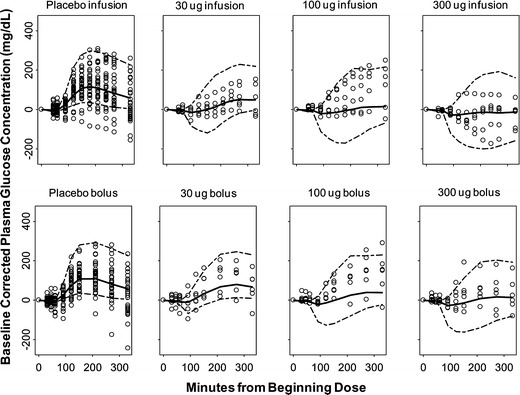
Fig. 6.

Baseline corrected visual predictive checks for plasma glucose concentrations versus time for each dose group. The dashed lines are the 90% prediction interval, and the bold line is the predicted median. The circles are the observed plasma glucose concentration values
