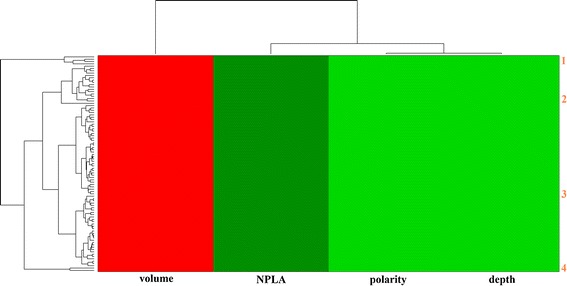
Fig. 4.

The heat map clustering of the binding pocket on the Ras protein. The horizontal axis labels are colored by properties of pockets (red for volume, green for depth, polarity, and NPLA; for further details, see the “Methods” section). Major pockets are indicated by the orange labels and corresponding marginal dendrograms
