
Fig. 6.
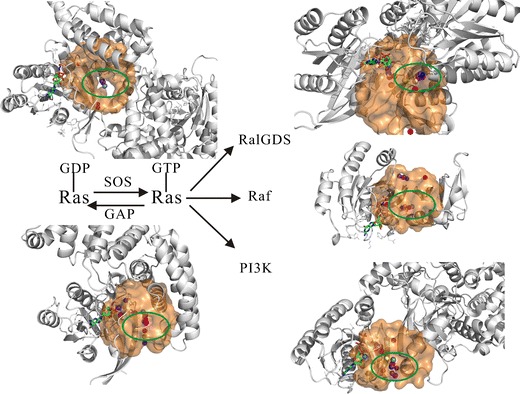
The binding pockets at the interfaces of Ras proteins with SOS, GAPs, RalGDS, Raf, and PI3K, respectively. The cycling between the active and inactive states of the Ras protein controlled with GEF (SOS) and GAP proteins is described, then the complexes containing five proteins previously mentioned are shown as a cartoon model (grey) and placed at the corresponding positions. The GTP on the Ras protein as an indicator is shown as ball and stick model, the centers of predicted pockets are labeled using the colored spheres (for further details, see the “Methods” section), the centers of predicted pockets at the interfaces are highlighted (green circle)