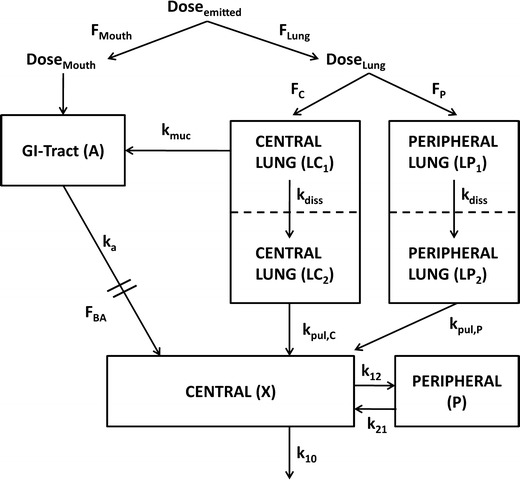
Fig. 1.

Compartment model for characterization of plasma concentration after administration of ICS. F Lung fraction of the emitted dose that is deposited in the lung, F Mouth fraction of the emitted dose that is deposited in the oropharynx, F C fraction of the lung dose that is deposited in central regions of the lung (LC1), F P fraction of the lung dose that is deposited in peripheral regions of the lung (LP1), LC 2 compartment representing central lung regions where the drug is dissolved, LP 2 compartment representing peripheral lung regions where the drug is dissolved, F BA oral bioavailability, k muc mucociliary clearance, k a drug absorption from the gut into the systemic absorption, k diss dissolution of drug particles, k pul,C drug absorption from central lung regions into the systemic circulation (central body compartment), k pul,P drug absorption from peripheral lung regions into the systemic circulation, k 12 and k 21 drug distribution between central and peripheral body compartments; k 10 drug elimination from the systemic circulation. All rate constants (k) were assumed to be first-order processes
