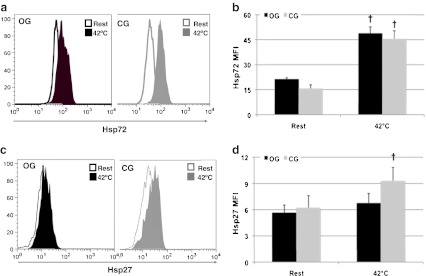
Fig. 4.
Heat shock protein induction in response to heat shock. a Representative histograms of Hsp72 levels in monocytes from both groups at rest and after 2 h incubation at 42 °C. bBar graphs representing means±SE. c Representative histograms of Hsp27 levels in monocytes from both groups at rest and after 2 h incubation at 42 °C. dBar graphs representing means±SE †p < 0.05 with baseline time point

