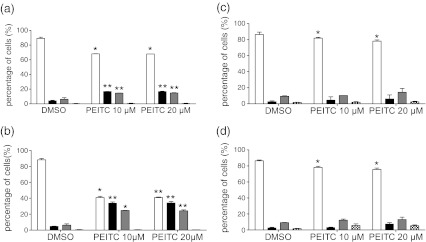
Fig. 2.
Apoptosis analysis in PEITC-treated cells. a, b MDA-MB-231 cells or c, d MCF7 cells were treated with PEITC (10 or 20 μM) or DMSO as a control for a, c 24 or b, d 48 h. Induction of apoptosis was analysed using annexin V (An)/propidium iodide (PI) staining (open bars, An−/PI−; closed bars, An+/PI−; grey bars, An+/PI+; hatched bars, An−/PI−). Data shown are means ± SD derived from three independent experiments. Statistically significant differences between DMSO and PEITC treated cells are indicated (*p < 0.05; **p < 0.005)

