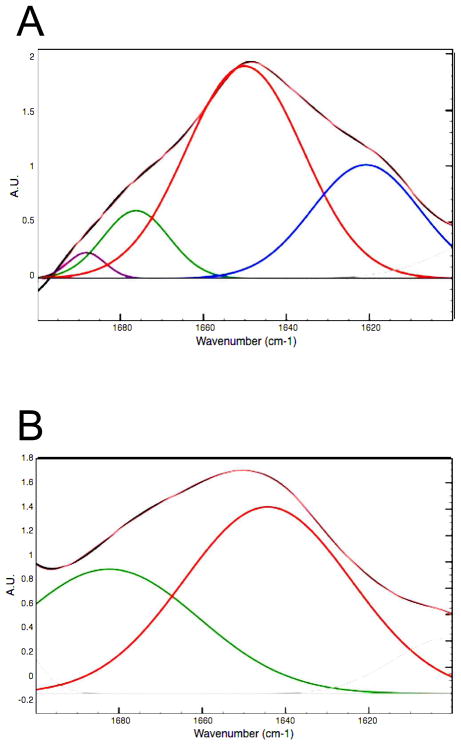
Figure 3.
Deconvolution of the FTIR absorption spectra for the WT (A) and V257STOP mutant (B) forms of ATF5 at 10 °C. Absorption in the Amide I (1600–1700 cm−1) and Amide II (1500–1600 cm−1) regions is plotted. The black outline denotes the parent absorption spectrum. The pink overlay indicates the fitted spectrum. Individual absorption peaks in the Amide I region are color-coded according the structure they represent (blue = extended structure; red = alpha helix/unordered; green = extended structure/beta turn; purple = beta turn).

