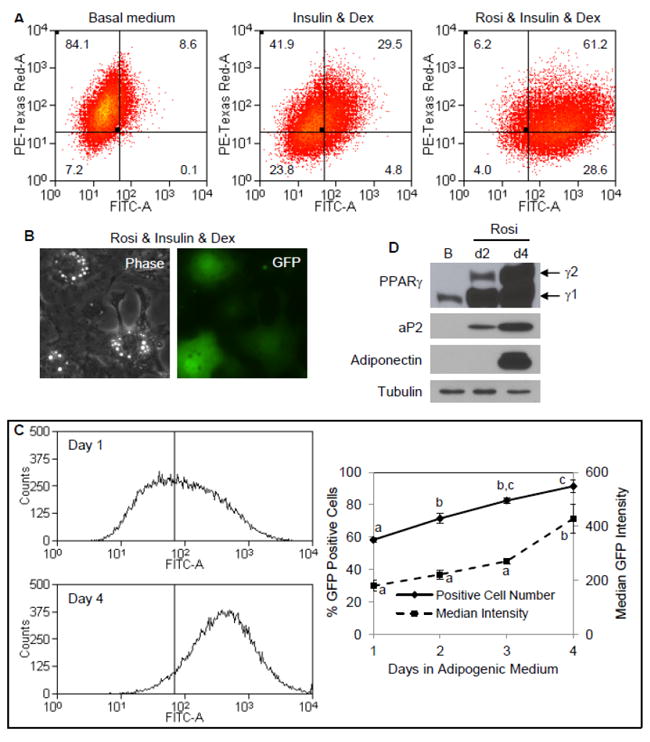
Fig. 4. Evaluating adipogenesis in individual cells using an aP2-GFP reporter.

mdMSC contained a GFPtopaz reporter for the aP2 promoter and a mCherry reporter for the SMαA promoter. (A) Cells were cultured in designated medium for 3 d prior to analysis by flow cytometry. Dex = dexamethasone; Rosi = rosiglitazone. (B) Fluorescent microscopy showing expression of aP2-GFP in individual cells after 4 d in adipogenic medium containing rosiglitazone, with a phase contrast image included to indicate cellular morphology. (C) Histograms (left) for aP2-GFP expression after 1 and 4 d in adipogenic medium. Vertical line indicates threshold for FITC intensity corresponding to positive GFP expression. Graph (right) showing positive GFP cell fraction and median GFP intensity versus days in adipogenic medium. Three experiments grouped for statistical analyses are shown in the graph. Days not sharing a letter are significantly different (p<0.05). (D) Immunoblots of total cellular proteins from cultures in adipogenic medium including rosiglitazone for 2 or 4 d compared to culture in basal (B) medium only.
