
Fig. 5. Sorting by GFP intensity identifies a committed adipogenic population.
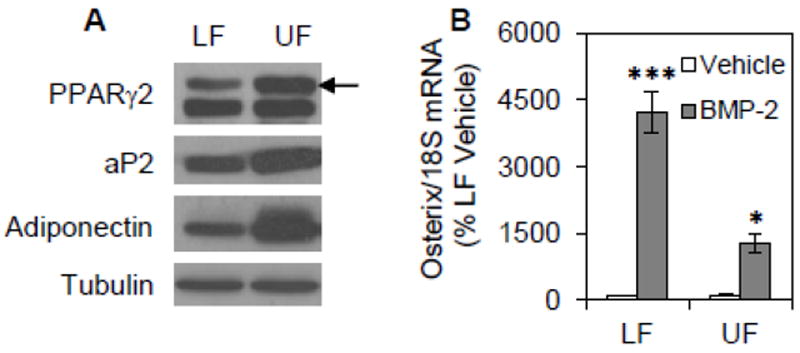
mdMSC containing the aP2-GFP construct were cultured in adipogenic medium including 5 μM rosiglitazone for 3d then sorted into two subpopulations based upon GFP intensity. The subpopulation with the highest GFP intensity (top quintile of total cell population; defined as the upper fraction or “UF”) was separated from the remainder of the cell population (defined as the lower fraction or “LF”). (A) Immunoblots of total cellular proteins isolated from each subpopulation. (B) The sorted subpopulations were re-plated into adherent culture. On the following day, cultures were treated with 125 ng/ml BMP-2 for 4 d. Designated mRNA was amplified by real-time RT-PCR. Representative data are shown as mean ± SEM and the experiment was repeated two times. * p<0.05, *** p<0.001 shows significant difference from vehicle.