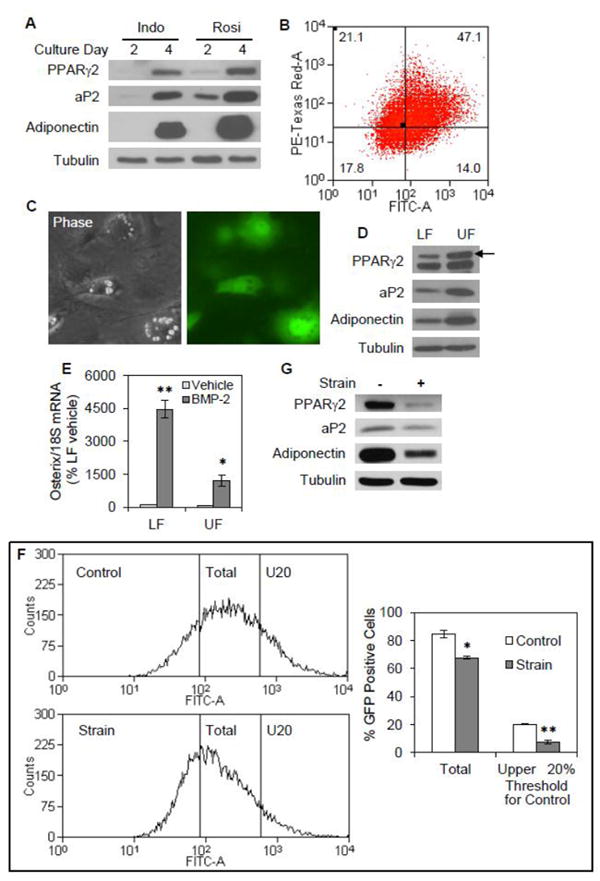
Fig. 7. Strain limits a committed adipogenic population induced by indomethacin.

mdMSC containing the aP2-GFP construct were cultured in adipogenic medium containing insulin, dexamethasone, and 50 μM indomethacin (Indo). (A) Immunoblots of total cellular proteins from mdMSC cultured in adipogenic medium including Indo or 5 μM rosiglitazone (Rosi) for 2 or 4 d. (B) Flow analysis of day 3 cultures. (C) Fluorescent microscopy showing expression of aP2-GFP in individual cells after 4 d in adipogenic medium containing inndomethacin, with a phase contrast image included to indicate cellular morphology. (D) mdMSC were cultured in adipogenic medium including indomethacin for 4d, and then sorted into two subpopulations based upon GFP intensity as described in figure 5. Immunoblots of total cellular proteins isolated from the upper fraction (UF) and the lower fraction (LF). (E) The sorted subpopulations were re-plated into adherent culture, and then treated with 125 ng/ml BMP-2 for 2 d. Designated mRNA was amplified by real-time RT-PCR. Data were compiled from two experiments. * p<0.01, ** p<0.001 shows significant difference from vehicle. (F) mdMSC in adipogenic medium were exposed to a daily strain regimen × 5 d and evaluated by flow analysis. Histograms (left) for aP2-GFP expression in unstrained, control cultures or cultures subjected to a daily strain regimen. Left vertical line indicates threshold for FITC intensity corresponding to positive GFP expression and right vertical line (U20) indicates threshold for FITC intensity corresponding to upper quintile of GFP expression in control cultures. Histogram data (n = 3 experiments) were analyzed for % GFP positive cell fraction corresponding to each threshold level (right). * p<0.01, ** p<0.001 shows significant difference from unstrained control. (G) Immunoblots of total cellular proteins from mdMSC treated as in (F).
