Figure 2.
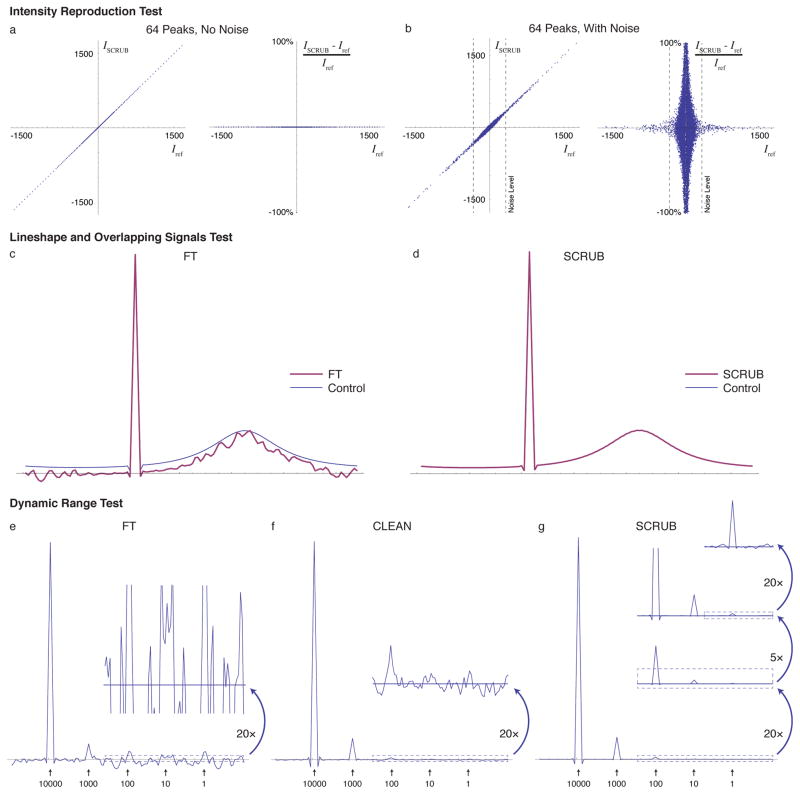
Tests of SCRUB Accuracy and Performance with Simulated Data. (a) Correlation and relative error plots comparing the intensity values in a simulated 3-D sparsely sampled (3189 time domain points, or 1.2% of conventional, distributed with cosine weighting, transformed into a 128 × 128 × 128 frequency domain, as is used for the 4-D experimental data later in the paper) spectrum of 64 peaks and no noise after SCRUB processing with that of a control spectrum without artifacts. SCRUB introduces no measureable error. (b) The same for a dataset also including simulated noise at a level of ~20% of the strongest signal. In the presence of noise, only a very slight error (comparable to the noise) is introduced by SCRUB. (c) 1-D trace of a 3-D simulated sparsely sampled (1.2%) spectrum containing two signals, one nondecaying of relative height 1.0 and the other Lorentzian with a full width at half height of ~25% of the spectral width and a relative height of 0.2, after FT processing. The control spectrum calculated using Nyquist sampling is shown as a thin trace. With sparse sampling, the lineshape of the broad peak is severely corrupted by artifacts. Note that the apparent vertical downshift is due to the convolution of the sparse sampling point response with the broad peak. (d) The same after artifact suppression with SCRUB, showing recovery of the correct lineshape and no problems due to the overlap of the two peaks (in this plot, the SCRUB trace exactly overlays the control trace). (e) 1-D trace of a simulated sparsely sampled spectrum (1.2%) containing five signals with relative intensities varying by five orders of magnitude, with white noise at ~10% of the weakest signal’s intensity; when processed using the FT alone, only the strongest two peaks are visible due to the sampling artifacts. (f) The same after processing with CLEAN. The third peak is now visible. (g) The same after processing with SCRUB. All peaks are visible. The residual noise and artifacts are only visible with 2000× magnification of the baseline.

