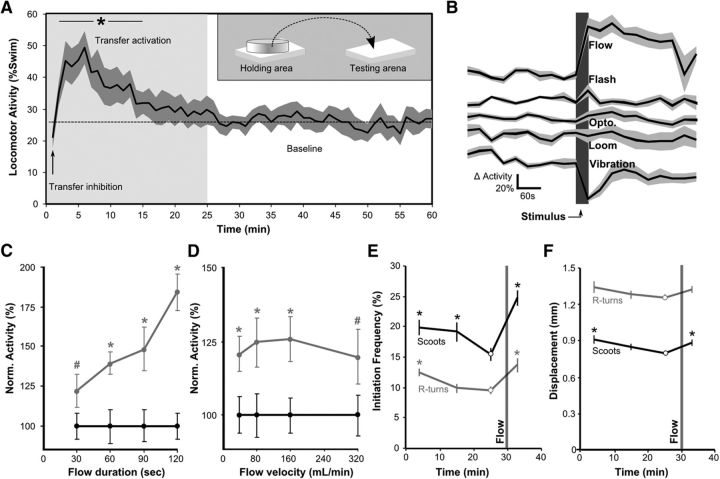
Figure 1.
Exposure to water flow induces a state of increased locomotor activity. A, Frequency of swim initiation after movement from a holding area to the testing arena (diagrammed in the inset). Epochs of activity patterns are indicated. Black line and shaded area show mean and SEM (n = 6 × 25). *p < 0.05 compared with baseline. B, Change from baseline activity after exposure to sensory cues. Larvae were left on the testing arena for 30 min before testing. Baseline is the mean swim initiation frequency in the 5 min before testing. Responsiveness during the presentation of the stimulus was not recorded, so these graphs do not show acute responses to the stimuli tested. Vibration, 500 ms duration, 10 Hz vertical acceleration, 62 m/s2 peak (n = 5 × 25). Loom, A shadow (contrast ratio of 18:1) moves across arena at 20 mm/s (n = 11 × 25). Optomotor (Opto), 30 s duration, 10 mm grating width, 2 Hz frequency, 18:1 contrast ratio (n = 7 × 20). Light Flash, 30 s dark pulse from baseline illumination at 150 μW/cm2 (n = 7 × 20). Flow, 45 s water flow, 40 ml/min (n = 8 × 20). C, D, Activity is proportional to the duration (C) but not to the velocity (D) of the flow stimulus. Trials were 20 min apart, with measurements taken of the locomotor activity during the 3 min before (black circles) and after (gray circles) each stimulus and activity for each before/after pair normalized so that the average before-flow value was set to 100. To test duration, flow velocity was held at 40 ml/min (n = 6 × 20). To test velocity, flow duration was 30 s (n = 7 × 20). #p < 0.05, *p < 0.01 for paired t tests. E, Kinematic analysis of swimming. The gray bar marks 15 s flow stimulus at 30 min. Pairwise comparisons are to baseline movement at 25 min (circles, n = 8 × 20). *p < 0.05. Graphs show mean and SEM. F, Total displacement generated by swim bouts with pairwise comparisons as for E.

