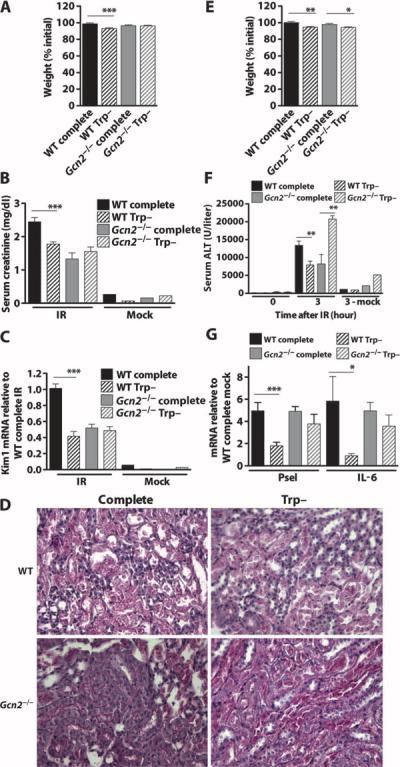
Fig. 3.

Requirement for Gcn2 in tryptophan deficiency-mediated protection against renal and hepatic IR. (A to D) Gcn2-mediated protection by tryptophan deficiency against renal IR. (A) Body weights of male mice (n = 12per group) fed the indicated diet for 6 days expressed as percent initial weight. (B) Renal function as indicated by serum creatinine 1 day after renal IR (n = 10 per group) or mock ischemia (n = 2 per group). (C) Kidney damage as indicated by mRNA abundance of kidney damage marker Kim1 mRNA as detected by quantitative PCR (qPCR) in kidney samples harvested 1 day after renal IR (n = 9 to 10 per group) or mock ischemia (n = 2 per group) and expressed relative to the wild-type (WT) complete IR group. (D) Representative images of PAS-stained kidney sections 1 day after reperfusion showing the corticomedullary junction, where most tubular damage occurs. (E to G) Gcn2-mediated protection by tryptophan deficiency against hepatic IR. (E) Body weights of female mice (n = 12 to 13 per group)fed the indicated diet for 6 days expressed as percent initial weight. (F) Serum ALT before (0 hours) or 3 hours after 45 min of hepatic ischemia (n = 5 to 10 per group) or mock IR (n = 2 to 3 per group). (G) mRNA abundance of proinflammatory markers P-selectin (Psel) and IL-6 as detected by qPCR in liver samples harvested 3 hours after hepatic ischemia (n = 4 to 5 per group) expressed relative to the WT mock-treated group. Error bars indicate SEM. Asterisks indicate the significance of the difference between the indicated groups by Student's t test for effect of diet within the same genotype. *P < 0.05; **P < 0.01; ***P < 0.001.
