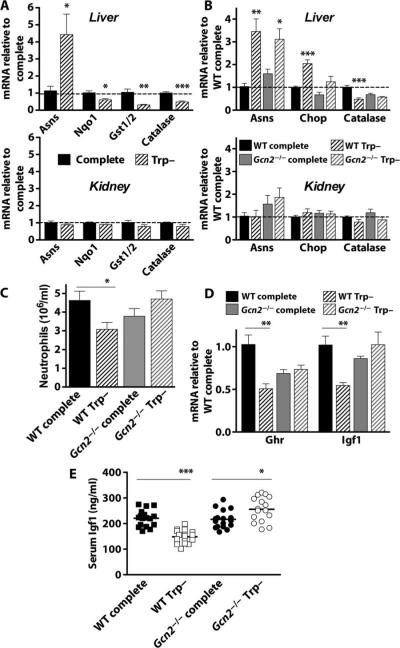
Fig. 4.
Organ-specific and systemic activation of the AASR by tryptophan deficiency. (A) Gene expression as determined by qPCR on material prepared from liver (top) and kidney (bottom) from wild-type (WT) male B6D2F1 mice preconditioned for 6 days with ad libitum access to tryptophan-deficient (Trp–) chow or pair-fed on complete chow (n = 4 to 5 per group). Gene expression is presented relative to complete diet treatment group (dashed line). (B) Gene expression in liver (top) and kidney (bottom) from WT or Gcn2−/−C57BL/6 male mice (n = 4 to 5 per group) on the indicated diet for 6 days. Gene expression is presented relative to the WT complete diet treatment group (dashed line). (C) Numbers of peripheral neutrophils in whole blood prepared from mice as in (B). (D) Expression of growth hormone receptor (Ghr) and insulin-like growth factor 1 (Igf1) mRNAs in liver as determined by qPCR (n = 4 to 5 per group) normalized to the WT complete diet treatment group. (E) Serum Igf1 protein levels after 6 days on the indicated diet (n = 16 per group). Error bars indicate SEM. Asterisks indicate the significance of the difference between the indicated groups by Student's t test for effect of diet within the same genotype. *P < 0.05; **P < 0.01; ***P < 0.001.

