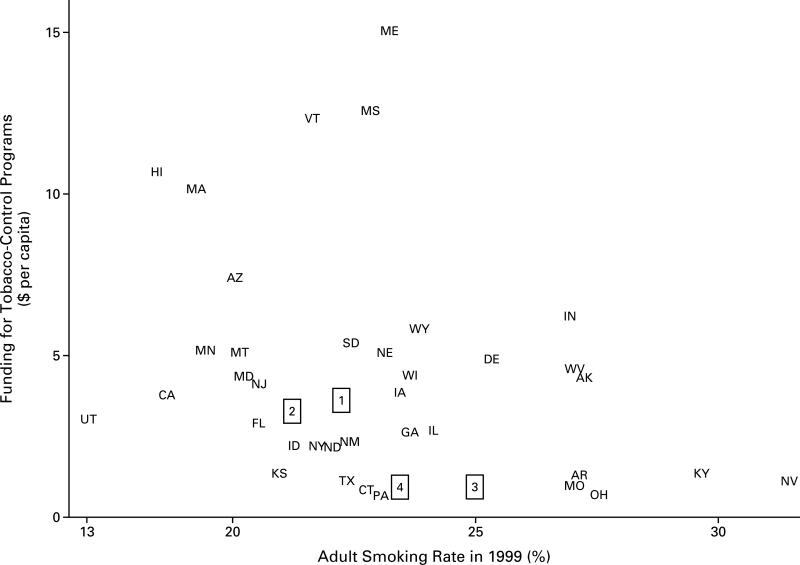
Figure 2. State Funding for Tobacco-Control Programs According to State Smoking Rates.
Several groups of states overlapped on the graph and are represented by the following boxed numbers: 1 — Colorado, Washington, Rhode Island, and New Hampshire; 2 — Oregon and Virginia; 3 — Tennessee, Michigan, North Carolina, and Oklahoma; and 4 — Louisiana, South Carolina, and Alabama.

