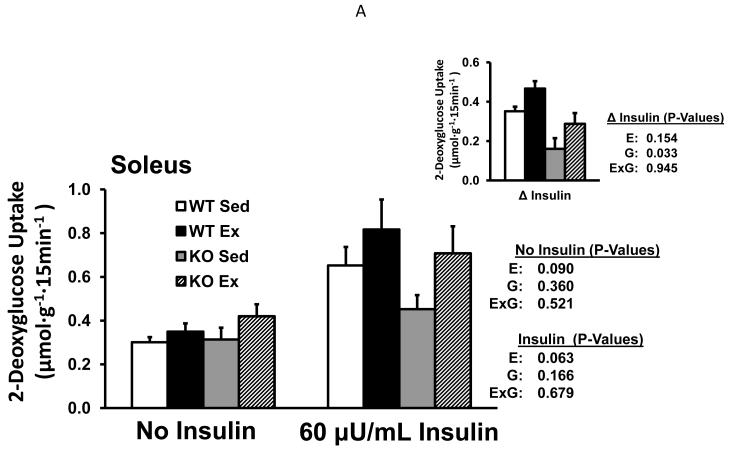
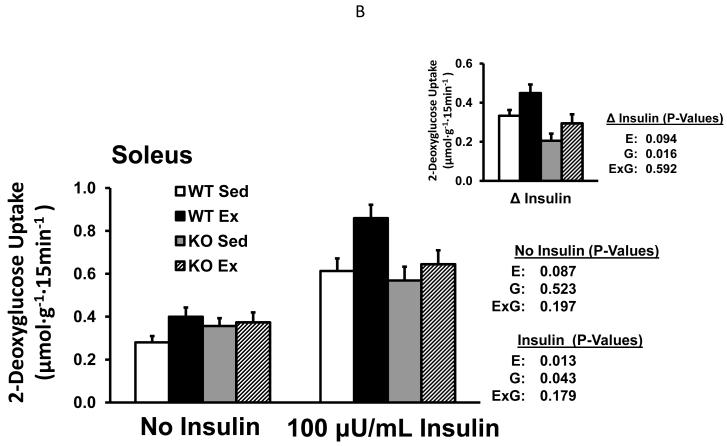
Fig. 1.
Glucose uptake by isolated soleus muscles (Experiment 1: without or with 60μU/mL insulin (A); Experiment 2: without or with 100μU/mL insulin (B) from WT and B2RKO mice that were sedentary (SED) or exercised (EX). Insets of (A) and (B) represent the insulin-stimulated increase in glucose uptake (delta insulin) calculated by subtracting the basal value from the insulin-stimulated value of paired muscles. Values are mean ± SE for 9 or 15-16 muscles per group (A and B, respectively). *P<0.05. E, main effect of exercise treatment; G, main effect of genotype; E x G, interaction between main effects.


