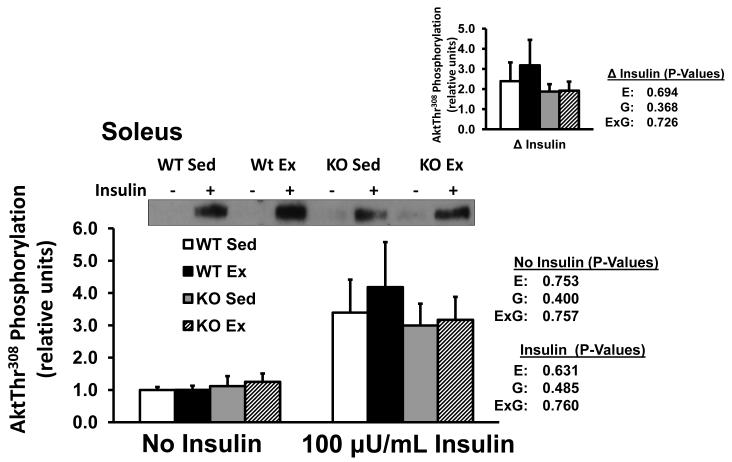
Fig. 2.
Akt threonine308 phosphorylation in isolated soleus from WT and B2RKO mice that were SED or EX. The insets represents the insulin-stimulated increase Akt threonine308 (delta insulin) calculated by subtracting the basal value from the insulin-stimulated value of paired muscles. Values are mean ±SE for 8 muscles per group.

