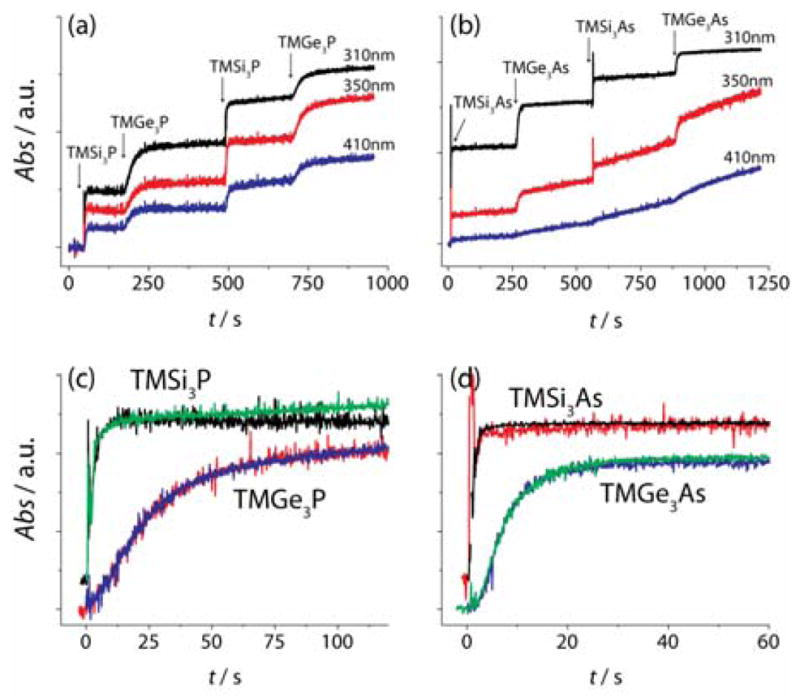
Figure 2.

Absorbance traces during precursor injection at 130°C for InP (a) and InAs (b). The injection of silyl-V and germyl-V precursor was alternated so that the absorbance rise could be directly compared. The absorbance rise at 310 nm (from a, b) is normalized truncated, and adjusted so that each injection is plotted with t=0 (c, d). The TMSi3V precursor injections in c and d are offset for clarity.
