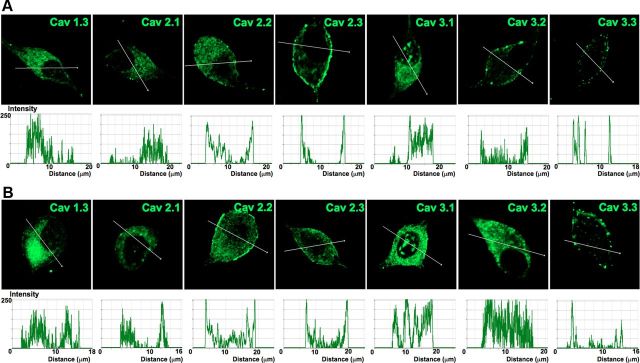
Figure 11.
Profile of Ca2+ channel expression in plasma membrane and cytosol of adult SGNs. To gauge the membrane expression of Ca2+ channels in SGNs, we assembled data from Figure 10 and plotted fluorescent intensity with respective distance across the diameter of neurons. A, B, Expression pattern of Ca2+ channels in apical neurons (A) and basal neurons (B). Scale bar, 10 μm.

