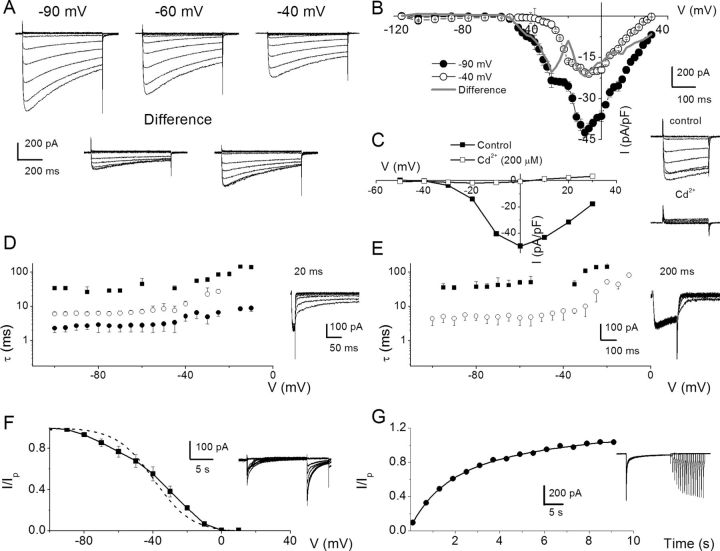
Figure 2.
Whole-cell Ca2+ currents in SGNs may contain several components. A, A family of membrane Ca2+ current traces recorded from SGNs using 5 mm external Ca2+. Inward Ca2+ currents were generated using depolarizing test voltages from −120 to 30 mV in 2.5–10 mV increments from a holding voltage of −90 mV. Current traces recorded from the same neuron from a holding voltage of −60 and −40 mV. The difference between current traces recorded at −90 and −60 mV (left, inset) and −90 and −40 mV (right, inset) holding voltages. B, Summary of the corresponding I–V relations for recordings at −90 (•) and −40 (○) mV holding voltages. Gray line shows the difference between currents at −90 and −40 mV. Data were summarized from n = 15. C, A family of control current traces generated from a holding voltage of −70 mV (right, inset). After application of Cd2+ (200 μm), the whole-cell Ca2+ current was blocked (inset). The corresponding I–V relations are shown (control, ■; Cd2+, □). D, SGNs were held at −80 mV and Ca2+ currents were elicited for 20 ms to 10 mV. At the end of the prepulse, the membrane voltage was polarized to different test voltages in 5 mV increments (between −100 and −5 mV), and the kinetics of the tail currents were examined. E, A similar protocol was applied using a 200 ms prepulse. The current traces are shown as insets. Summary data of the relations between the time constant of deactivation (■,•,○) and test voltages using 20 (D) and 200 ms (E) prepulses (n = 10). Invariably, multiple deactivation time constants were documented using shorter prepulse voltages. Three time constants were derived using 20 ms prepulse. In contrast, two time constants best fitted the deactivation kinetics using 200 ms prepulse. F, Exemplary current traces elicited to generate steady-state inactivation curves depicted in inset. The neuron was held at −70 mV and stepped to conditioning voltages varying from −100 to 40 mV for ∼15 s, followed by a test voltage at 10 mV. The current was normalized against the noninactivating component evoked at the test voltage. The dotted curve represents a first-order Boltzmann function fit. However, the data were best fitted with a second-order Boltzmann function (solid line). The half-inactivation voltages (V½–1, mV) were −65 ± 8 (at ∼35% contribution) and (V½–2) −32 ± 3 (at ∼65% contribution) (n = 9) and the maximum slope factors (k, in mV) were 9.0 ± 1 and 10 ± 2 (n = 9). G, Neurons were held at −80 mV and stepped to conditioning prepulse (10 mV) to make a transition from activation to inactivation. Subsequently, test pulses at varying time intervals were applied. The traces shown in inset are a family of currents obtained after applying a set of pulses as described. The currents elicited at the test pulse at specific times after the conditioning prepulse were normalized against conditioning pulse-evoked current and plotted against time. At least two time constants (τ) of recovery from inactivation were obtained: τ1, 1.3 ± 0.2 s; τ2, 7.2 ± 1.6 s; n = 11.

