Figure 8.
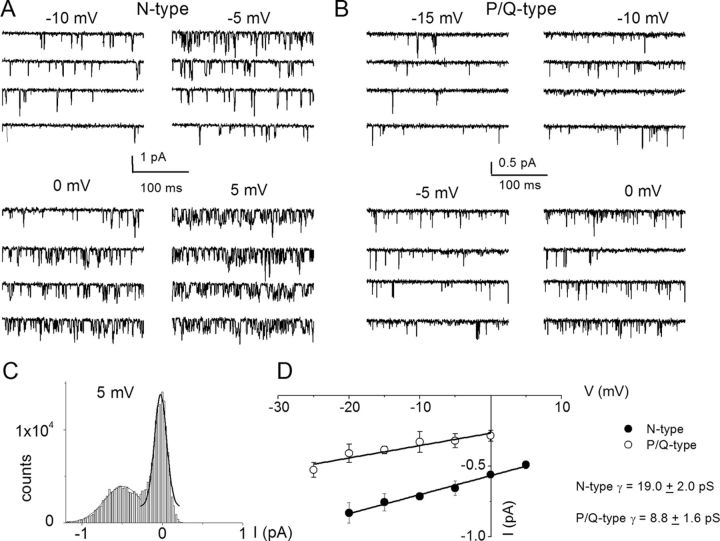
Single-channel recordings of N-type and P/Q-type channels in SGNs. A, Inward Ba2+ currents through single Ca2+ channels were recorded in membrane patches from isolated 3-month-old SGNs. For recordings of N-type single-channel activity, we included a mixture of Ca2+ channel blockers containing the following: 10 μm nimodipine, 1 μm ATX, 200 nm ω-(rSNX-482), and 5 μm mibefradil in the external and patch-electrode solutions. The membrane patch was held at −70 mV and stepped to test voltages indicated above each set of four consecutive traces. The solid dotted lines denote the closed levels. The test potential for the example shown is 5 mV. C, Representative I–V plots for N-type channels show single-channel conductance of 19 ± 2 pS (n = 7). B, To record the unitary P/Q-type single-channel fluctuations, we included a mixture of Ca2+ channel blockers containing the following: 10 μm nimodipine, 1 μm CTX, 200 nm ω-(rSNX-482), and 5 μm mibefradil in the external and patch-electrode solutions. Under outside-out cell-attached configuration, 3-month-old SGN membrane patches were held at −70 mV and stepped to the depolarizing potentials, as indicated beside the family of consecutive traces. We used 50 mm Ba2+ as the charge carrier. C, The amplitude histogram from current traces at 5 mV step potential is shown. Similar data were used to generate the unitary I–V plots. D, The scattered points of the I–V relation were fitted with a linear regression to determine the conductance of the P/Q channels. For the summary data shown, the single-channel conductance (γ) values for P/Q-type channels in 50 mm Ba2+ is 8.8 ± 1.6 pS (n = 6).

