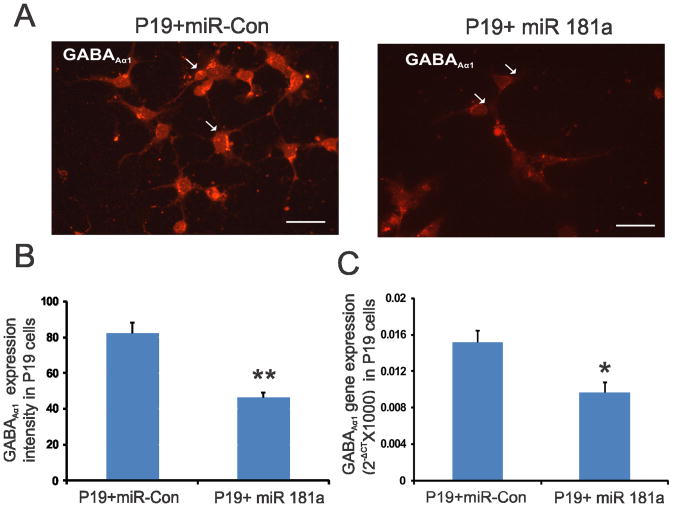
Figure 3.
A: GABAAα−1 immunostaining of neuronally differentiated P19 cells transfected with Pre-miR-181a and Pre-miR-negative control. B: the intensity of staining for 10 individual cells from each group was determined and presented as means±SD. The scale bar is 50 μm. C: Real-time RT-PCR analysis of GABAAα−1 gene expression in neuronally transfected P19 cells transfected with miR-181a. Three sets of transfections were carried out and GABAAα−1 gene expression relative to reference gene ribosomal RNA was presented using formula 2− (CTGABAAα−1 − CTrRNA). Asterisks indicate significant difference at p value of <0.01(*) and <0.001(**).

