Figure 4.
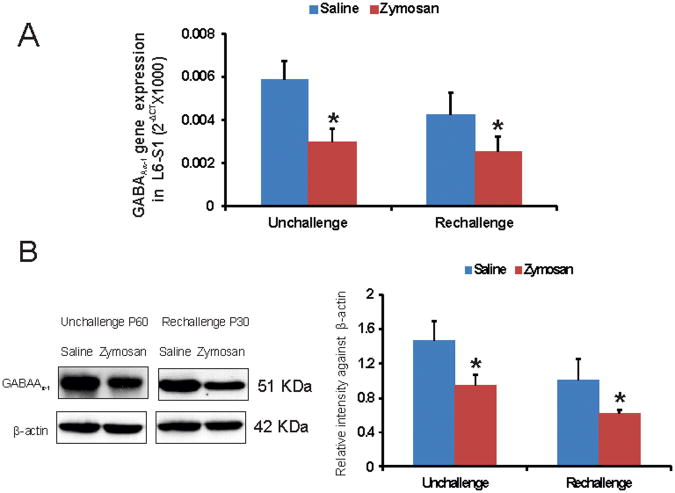
A: Real-time RT-PCR analysis of differentially expressed GABAAα−1 gene in spinal dorsal horns (L6-S1) from rats with neonatal cystitis. Two different treatment protocols were followed and tissues were examined on P60 from unchallenge protocol and on P30 from re-challenge protocol. The ordinate value 2−ΔCT corresponds to the mRNA expression relative to reference gene ribosomal RNA (rRNA) and represented as mean ± SD (n=5/group). B: westernblot analysis of GABAAα−1 protein spinal dorsal horn samples (L6-S1) from rats with neonatal cystitis. The intensity of GABAAα−1 immunoreactivity for different tissues was normalized against the intensity of β-actin expression for the same tissue. Results were expressed as means ± SD (n=5/group). Asterisks indicate significant difference at p value of <0.05 (*).
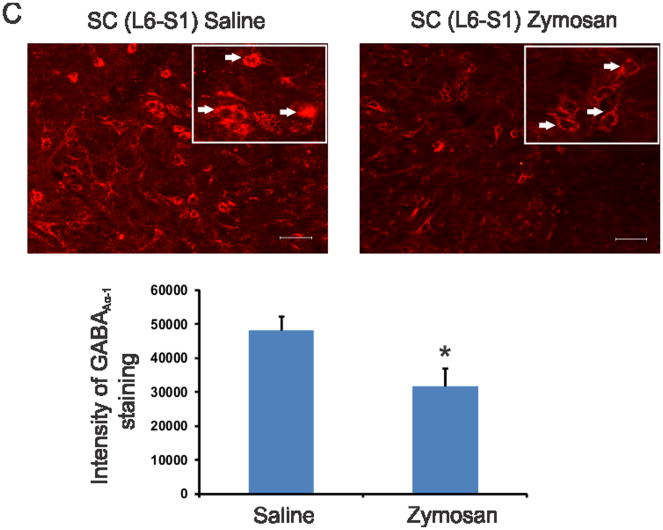
Figure 4C. GABAAα−1 immunostaining of differentially expressed GABAAα−1 gene in spinal dorsal horns (L6-S1) from rats with neonatal cystitis. The tissues were examined on P60 following zymosan/saline treatment at P14-P16. The scale bar is 50 μm. The intensity of staining for 10 individual cells from each group was determined and presented as means±SD. Asterisk indicate significant difference at p value of <0.001 (*).
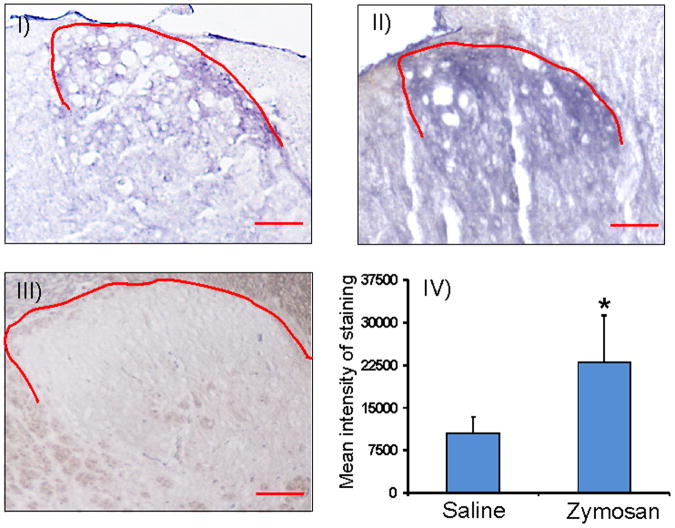
Figure 4D: miR 181a staining of spinal cord (L6) tissues from rats with neonatal cystitis using in situ hybridization protocol. The tissues were examined on P60 following zymosa or saline treatment at P14-P16. The scale bar is 20 μm. The red line indicates the area of spinal dorsal horns exhibiting miR 181a expression in saline (I), zymosan (II) treated animals. The scrambled miRNA used as negative control shows no significant staining in spinal dorsal horn lamina from saline treated rats (III). The mean intensity of miR 181a expression was calculated by subtracting the mean background staining from the staining in the selected regions fromr saline and zymosan-treated rats. Results were expressed as mean±SD, n=3/group (IV). Asterisk indicates significant difference at p value of <0.05 (*).
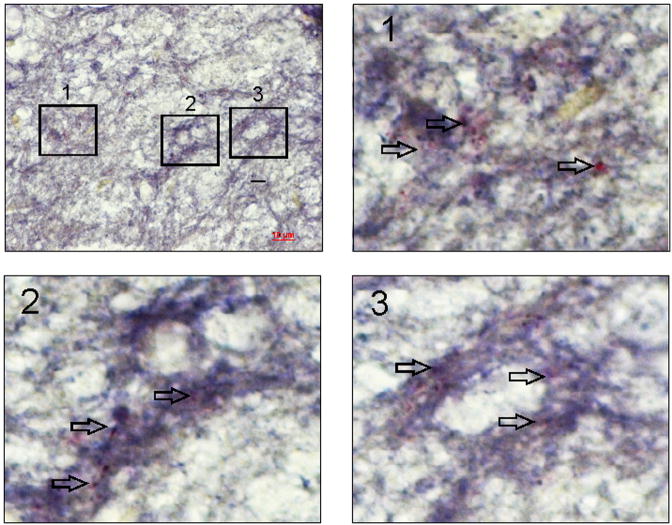
Figure 4E: An example of dual in situ hybridization and immunohistochemistry in spinal cord (L6) from zymosan-treated rat to demonstrate coexpression of miR 181a and its target protein GABAAα−1 in the dorsal horn neurons. The scale bar is 10 μm. The arrows in enlarged images 1, 2 & 3 demonstrate colocalization of miR 181a (purple) and GABAAα−1 (red) mostly on the cell membrane.


